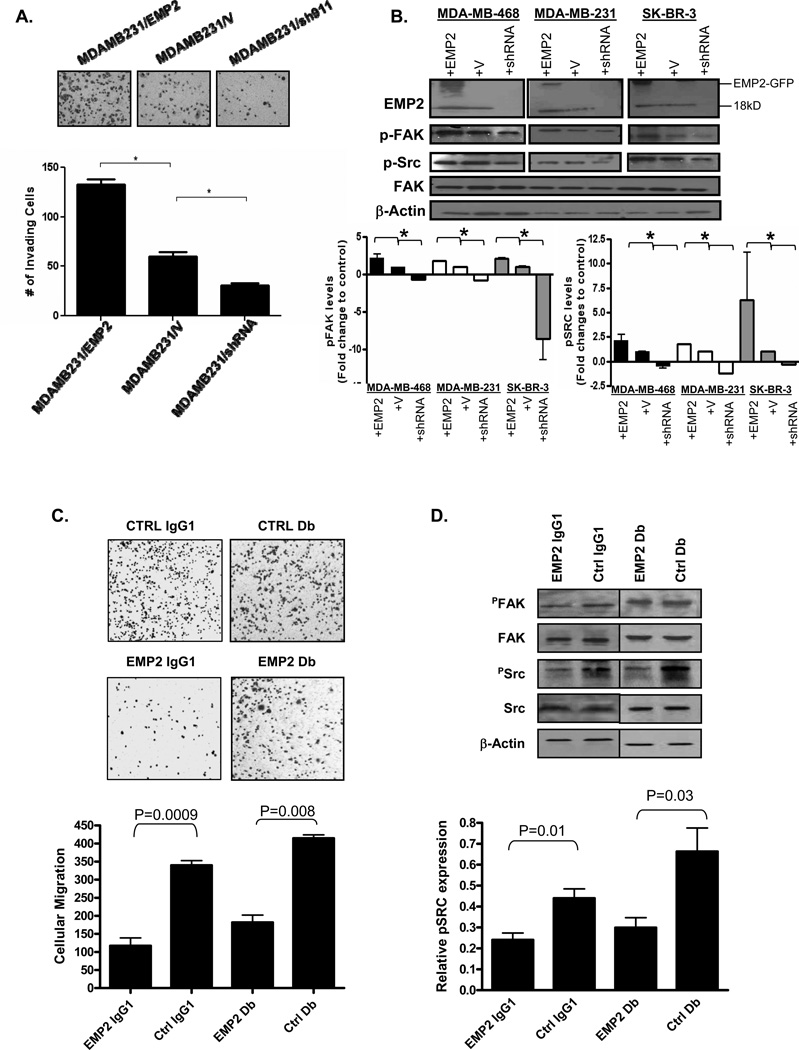
Figure 5. EMP2 promotes cellular migration andanti-EMP2 IgG1 antibodies and diabodies suppress this effect.
(A) MDA-MB-231 cells were engineered to overexpress EMP2 (MDAMB231/EMP2), express a vector control (MDAMB231/V) or reduce its expression via shRNA lentiviral vectors (MDAMB231/shRNA). Equivalent numbers of cells were plated into transwells and enumerated after 6 hours. The experiment was repeated three times and the results averaged. *, p<0.05 as determined by Student’s unpaired t-test. (B) MDA-MB-231, MDA-MB-468, and SK-BR-3 cells were engineered to overexpress or reduce EMP2 expression as above. Cells were plated for 12 hours and FAK and Src activation were assessed by western blot analysis. N=3; *, p<0.05, Student’s unpaired t-test. (C) 60 µg/ml anti-EMP2 IgG1 or control IgG or 20 µg/ml anti-EMP2 or control Db were added to MDA-MB-468 cells for 1 hr. The number of cells that migrated through the transwell was measured. Top panel: cells were visualized using crystal violet. Bottom panel: averaged number of migrated cells from 3 experiments. (D) 60 µg/ml anti-EMP2 IgG1 or control IgG was added to MDA-MB-468 cells for 1 hr. Alternatively, 20 µg/ml anti-EMP2 or control Db were added. Cells were then plated for 12 hrs and lysed. Proteins were separated by SDS-PAGE and probed using the indicated antibodies. The experiment was repeated three times, and representative image is shown. Bottom panel, Activated pSRC expression from three experiments was quantified using Image J, and the data was normalized relative to total Src levels. Treatment with anti-EMP2 IgG1 or anti-EMP2 Db significantly reduced pSRC expression. Values are averages (±SEM).

