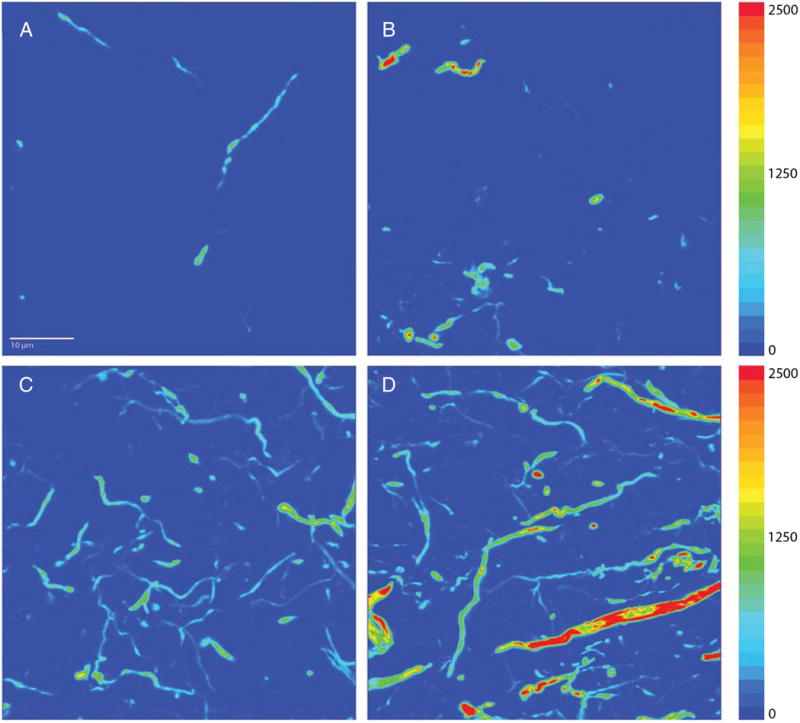
Fig. 5.

Representative images demonstrating the difference in mean AT8 intensity between AD−P (A, C) and AD+P (B, D) in subjects at Braak stages characterized by lower (stage IV; A, B) and higher (stage VI; C, D) degrees of pTau burden. These images were deconvolved using the no-neighbors algorithm. Adjacent color bars reflect grayscale levels.
