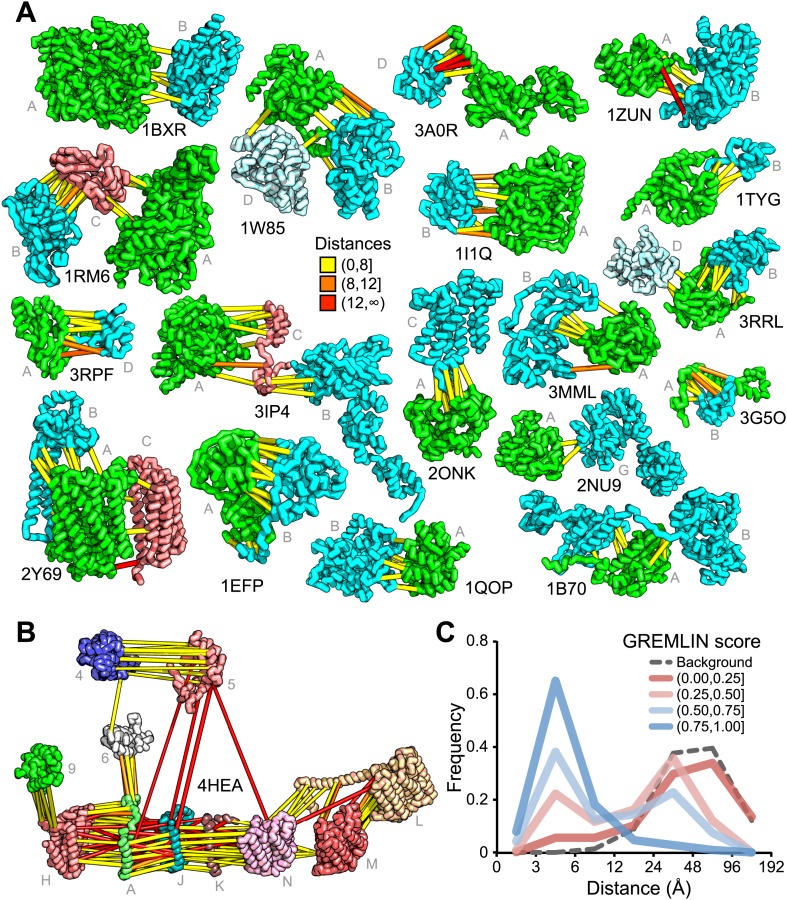
Figure 2. Residue covariation in complexes with known structures.
(A) Residue-pairs across protein chains with high GREMLIN scores almost always make contact across protein interfaces in experimentally determined complex structures. All contacts with GREMLIN scores greater than 0.6 are shown; the structures are pulled apart for clarity. Labels are according to chains in the PDB structure. (B) Complex I of the electron transport chain has an unusually large number of highly co-varying inter residue pairs not in contact in the crystal structure of 4HEA; these contacts may be formed in different state of the complex. Residue pairs within 8 Å are in yellow, between 8 Å and 12 Å in orange, and greater than 12 Å, in red. Distances are the minimal distances between any side chain heavy atom. Labels are according to chains in 4HEA. (C) Dependence of inter-residue distance distributions on GREMLIN score. All residue–residue pairs between subunits in the benchmark set were grouped into four bins based on their GREMLIN score (colors), and the distribution of residue–residue distances (x axis) within each bin computed from the three-dimensional structures. See Figure 2—source data 1 for the table of all the interfaces used in the calculation.
DOI: http://dx.doi.org/10.7554/eLife.02030.005

