Figure 6.
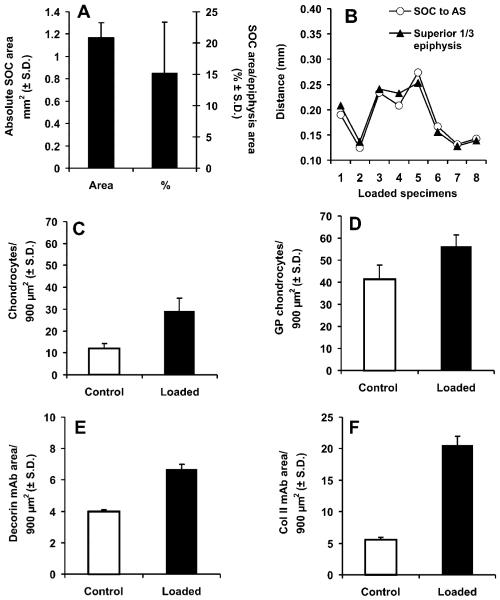
Computer-assisted histomorphometric quantification. (A) The area occupied by the secondary ossification center (SOC) in mechanically loaded specimens (N = 8) was significantly higher than the unloaded control specimens (N = 8). The average area occupied by the SOC divided by the total area of chondroepiphysis in cyclically loaded explants (N = 8) was significantly higher than control explants (N = 8). (B) The location of the SOC within the epiphysis was measured by the vertical distance from the articular surface perpendicular to the midpoint bisecting the largest width of the SOC. AS, articular surface. (C) The average number of hypertrophic chondrocyte-like cells surrounding the SOC in cyclically loaded explants (N = 8) was significantly greater than the corresponding region of the control explants (N = 8) (p < 0.001). (D) The average number of hypertrophic chondrocytelike cells superior to the future growth plate (c.f. Fig. 2) in cyclically loaded explants (N = 8) was significantly greater than corresponding regions of the control explants (N = 8) (p < 0.001). (E) The intensity of decorin monoclonal antibody (mAb) staining in hypertrophic chondrocytelike cells surrounding the SOC in cyclically loaded explants (N = 8) was significantly greater than corresponding regions of the control explants (N = 8) (p < 0.01). (F) The intensity of type II collagen antibody staining in hypertrophic chondrocytelike cells surrounding the SOC in cyclically loaded explants (N = 8) was significantly greater than corresponding regions of the control explants (N = 8) (p < 0.01). **p < 0.01; ***p < 0.001.

