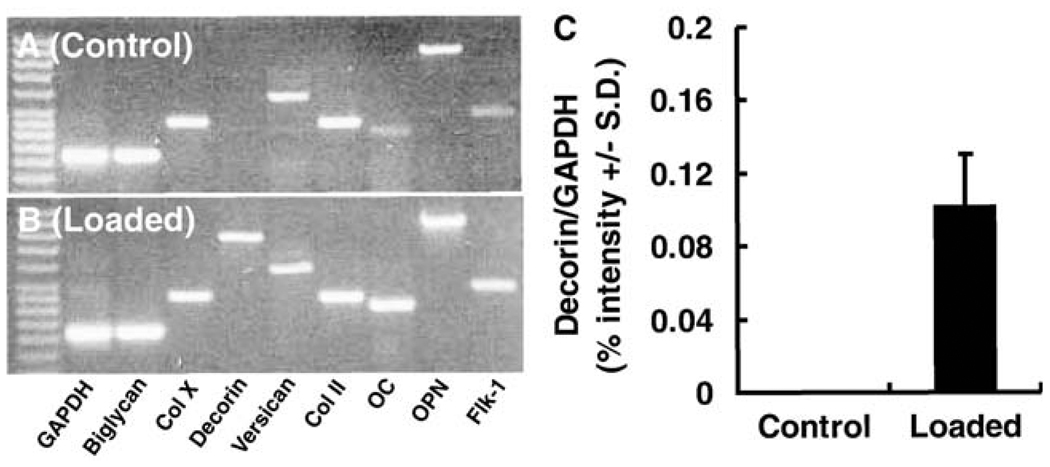
Fig. 2.
mRNA expression of cartilage- and bone-related genes in CBGP at postnatal day 8. a Representative gel image showing the expression of biglycan, type X collagen (Col X), versican, type II collagen (Col II), osteocalcin (OC), osteopontin (OPN), and fetal liver kinase 1 (Flk-1; an angiogenesis-related gene). Note the absence of decorin gene expression in control CBGP samples without mechanical loading. b Representative gel image showing the expression of the decorin gene (non-detectable in a), together with the expression of biglycan, type X collagen (Col X), versican, type II collagen (Col II), OC, OPN, and Flk-1. c Semiquantitative analysis of luminosity of the average intensity of gel bands of decorin gene expression (ratio to GAPDH expression) in control (n=8) and mechanically loaded (n=10) samples showing the average intensity of decorin expression in mechanically loaded samples (0.10±0.03), in contrast to the lack of decorin expression in age- and sex-matched control samples

