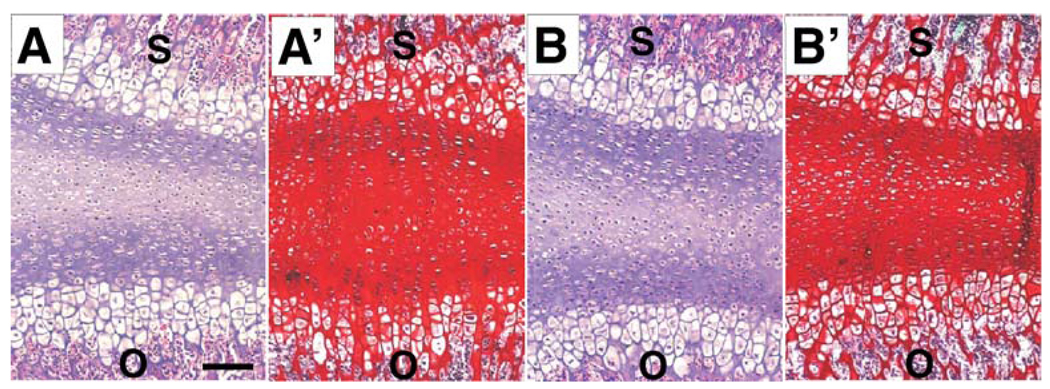
Fig. 3.
Histological examination of CBGP samples with and without mechanical loading. Representative H&E image of a control CBGP (a) and a mechanically loaded CBGP (b) showing the equivalent of two appendicular growth plates with their reserve zones merged together. The sphenoid (s) and occipital (o) bones are labeled for orientation. Representative safranin O and fast green images show abundant chondroitin sulfate and keratan sulfate proteoglycans in the CBGP in a control CBGP sample (a’) and a mechanically loaded CBGP sample (b’). Bar 50 µm

