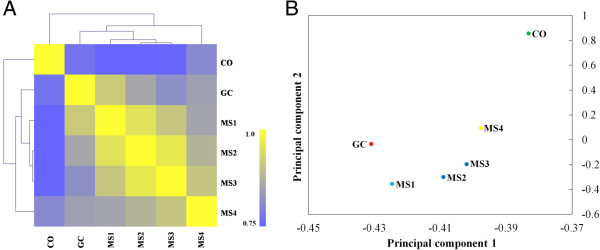
Figure 2.

Correlation in expression patterns among the six RNA-sequenced libraries. A. Heatmap of the Pearson correlation of RNA-Seq samples according to gene expression level. Clustering was analyzed based on the expression data of 10,158 genes. B. Principal component analysis (PCA) of the transcriptomes during microsclerotia formation and germinating conidia. For the principal components 1 and 2, eigenvalues are 86.2% and 6.7%, respectively. The analysis was performed by the MultiExperiment Viewer using the expression data from 10,158 genes.
