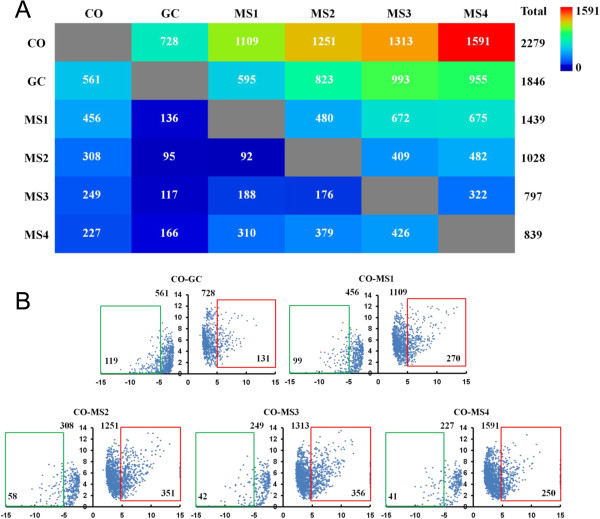
Figure 5.

Significant changes in gene expression and the distribution of differentially expressed genes. A. The color-coded matrix shows number of significantly up-regulated genes in pairwise comparisons. Total represents the total number of genes significantly up-regulated compared to all other samples. Height, a complete gene significantly up-regulated genes (q value <0.05). B. The distribution of log2 fold-change and log2 expression value of the GC, and MS1-MS4 developmental stages compared to the CO stage. The y axes are log2 FPKM + 1of expressed genes in GC, and MS1-MS4 stages, and x axes are log2 fold change of the corresponding expression value compared with that of the CO stage. The numerical value on the top of each chart represents the number of differentially expressed genes, down- (left) or up-regulated (right). The numerical value in the green or red boxes indicates the number of up- or down- regulated genes with >5 fold-change.
