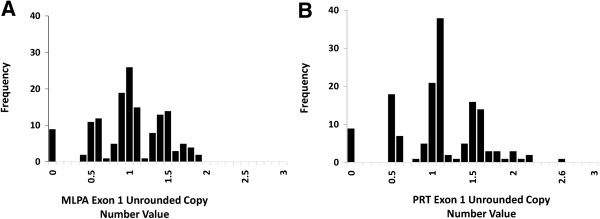
Figure 2.

The distribution of unrounded CCL3L1 copy number measurements plotted on a histogram from the PRT and MLPA exon 1 assays. A. The MLPA assay demonstrates clear clustering, with peaks centered on integer values and gaps between each of the clusters ranging from 0–4 copies. B. The PRT assay demonstrates a distribution of 0–5 copies, with peaks clearly centered on integer values.
