
Figure 1.
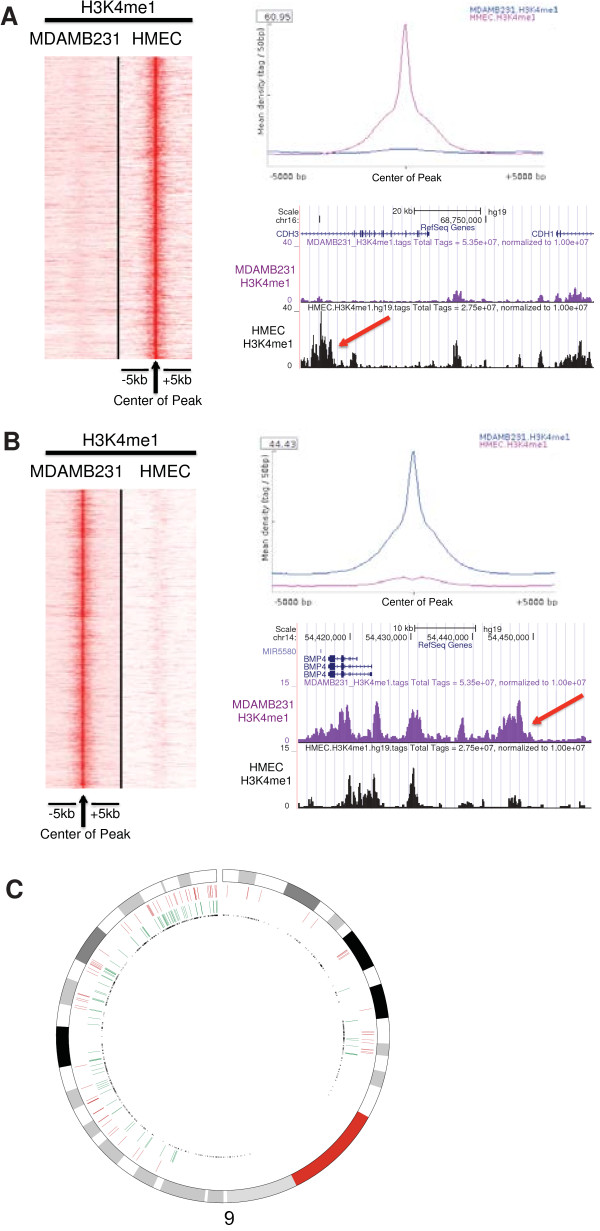
Cell type specific enhancer loci identification in breast epithelial cells (HMEC and MDAMB231). (A) H3K4me1 ChIP-seq tags from both cells at the center of HMEC specific enhancer loci (HSEL) were graphed in the heatmap (red: higher density) (left). Mean density of H3K4me1 ChIP-seq tags from both cells at the HSEL (top right). An example of the HSEL was located in the intron of CDH3 gene, near CDH1 gene (red arrow) (bottom right). (B) H3K4me1 ChIP-seq tags from both cells at the center of MDAMB231 specific enhancer loci (MSEL) were graphed in the heatmap (red: higher density) (left). Mean density of H3K4me1 ChIP-seq tags from both cells at the MSEL (top right). An example of the MSEL located 20 kb upstream of the BMP4 gene (red arrow) (bottom right). (C) Genomic distribution of cell type specific enhancer loci in chromosome 9 (red: HSEL, green: MSEL, black: transcription start sites).