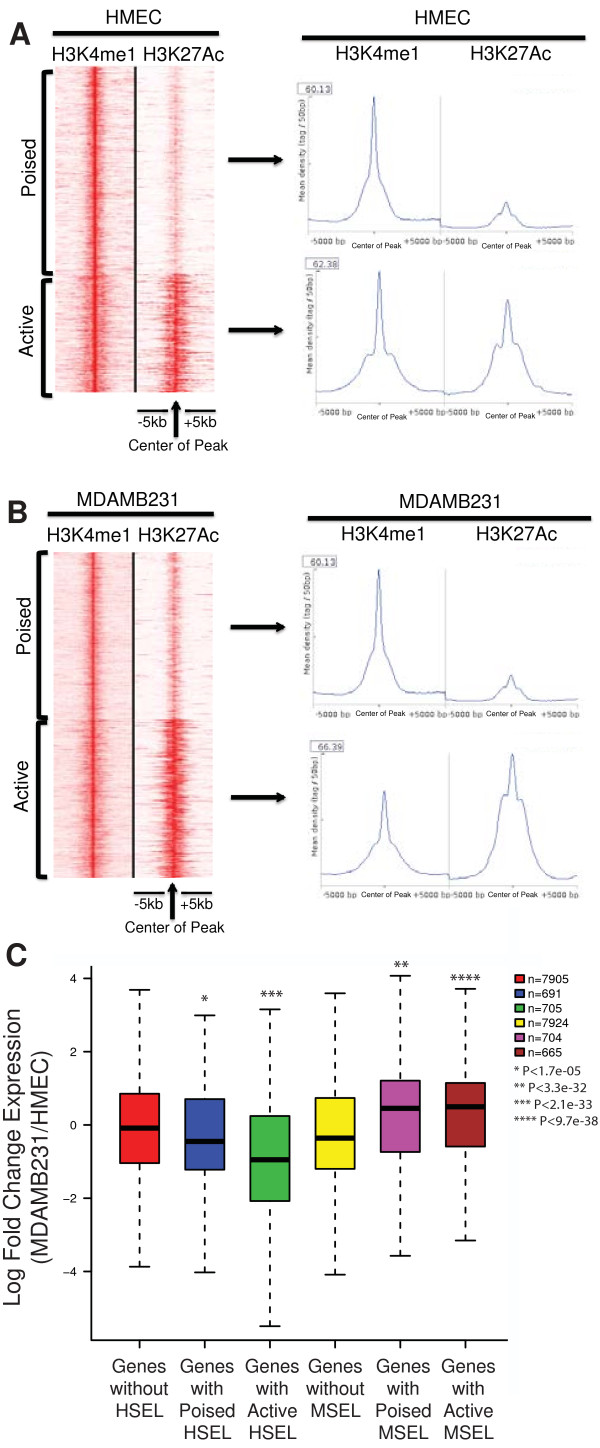
Figure 3.

Poised and active enhancers. (A) H3K4me1 and H3K27Ac ChIP-seq tags from HMEC at the HSEL were graphed in the heatmap (red: higher density) (left). Mean density of H3K4me1 and H3K27Ac ChIP-seq tags from HMEC at the poised HSEL (top right) and the active HSEL (bottom right) (B) H3K4me1 and H3K27Ac ChIP-seq tags from MDAMB231 at the MSEL were graphed in the heatmap (red: higher density) (left). Mean density of H3K4me1 and H3K27Ac ChIP-seq tags from MDAMB231 at the poised MSEL (top right) and the active MSEL (bottom right) (C) Log fold change of nearby gene expression boxplot for the poised/active HSEL and poised/active MSEL. Student t-test was applied between groups in order to calculate p-values.
