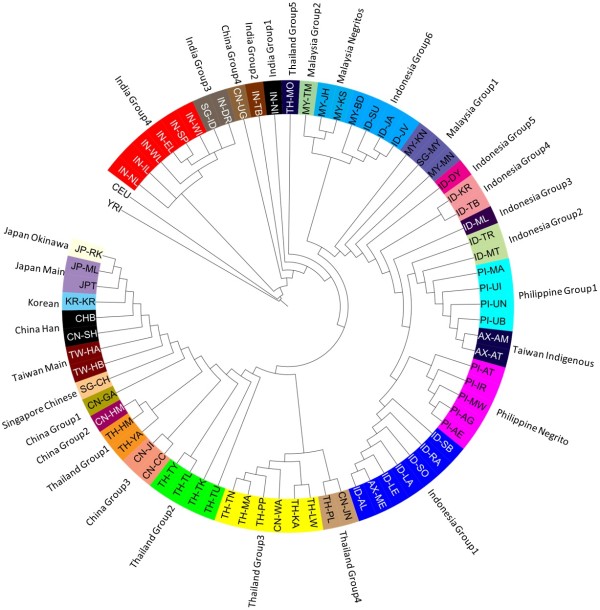
Figure 2.

Clustering of the PASNP and HapMap populations. A phylogenetic tree obtained using a maximum likelihood procedure in the PHYLIP package on the genotype data for SNPs in the autosomal chromosomes to cluster the PASNP and HapMap populations. Cross-referencing the populations found within the same major branches indicated that genetic similarities concurred with linguistic and geographic similarities.
