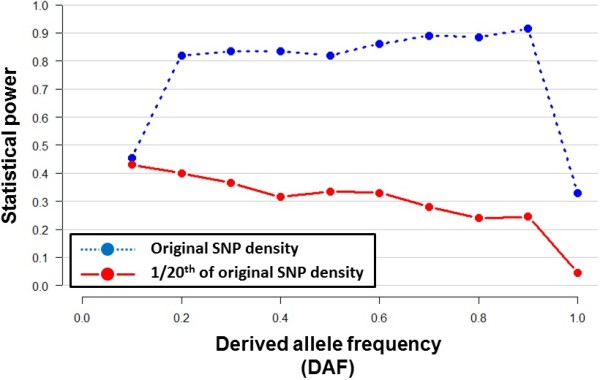
Figure 3.

Statistical power of haploPS. Statistical power of haploPS to successfully identify a genomic region simulated to possess an advantageous derived allele at different allele frequency was evaluated in two settings using simulated data that is publicly available from the haploPS website: (i) with data of the original SNP density (blue dotted line and circles); and (ii) when the SNP density is reduced to 1/20th of the original SNP density which is meant to reflect the density of SNPs in PASNP (red solid line and circles). Power was calculated from 2,000 simulated regions at a false discovery rate of 1%, defined against the empirical null distribution of the haploPS score obtained from a separate set of 2,000 simulated regions without positive selection.
