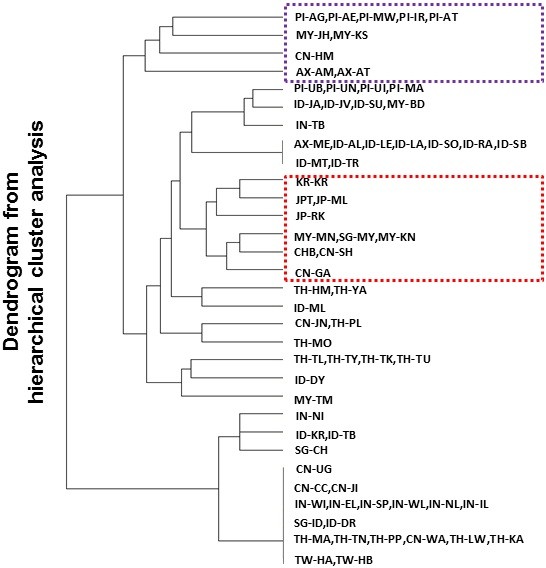
Figure 5.

Clustering of PASNP population groups by selection signals. Hierarchical clustering of the 31 PASNP population groups according to the absence or presence of the 59 positive selection signals that have been identified by haploPS. Each of the 59 signals is present in at least one of the 31 population groups. The hierarchical clustering is performed using the Ward’s minimum variance method with the hclust command in R. Populations found in one of the major branches correspond to indigenous populations from Malaysia, Philippines, Thailand and China (upper purple box), while populations found in one of the sub-branches correspond to those in northern East Asia (lower red box).
