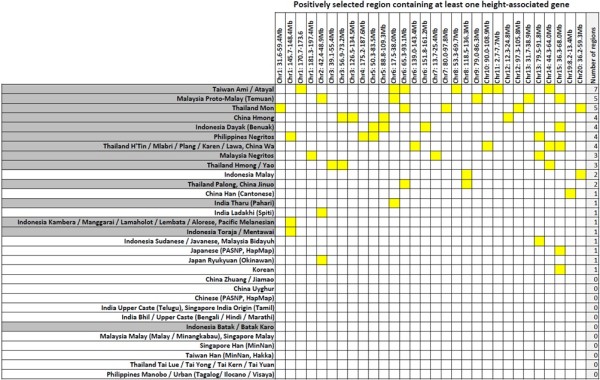
Figure 6.

Selection signals containing at least one height-associated gene. Distribution of the 30 positive selection signals that spanned at least one height-associated gene across the 31 PASNP population groupings. Each yellow block indicates that the specific selection signal (column header) is present in a particular group of PASNP populations (row header). The groups are ranked according to the number of selection signals in descending order (last column). Population groupings that correspond to indigenous populations are shaded in grey.
