
Figure 3.
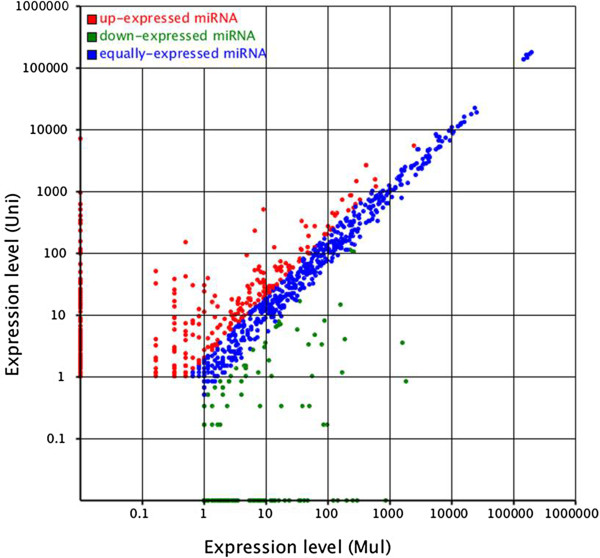
Differences of miRNA expression between the two libraries. Note: The scatter plot of differentially expressed miRNAs (control: X-axis, treatment: Y-axis). The X and Y show the expression level of miRNAs in the two samples respectively. Red points represent miRNAs with ratio > 2; Blue points represent miRNAs with 1/2 < ratio ≤ 2; Green points represent miRNAs with ratio ≤ 1/2. Ratio = normalized expression of the treatment/normalized expression of the control.