
Figure 3.
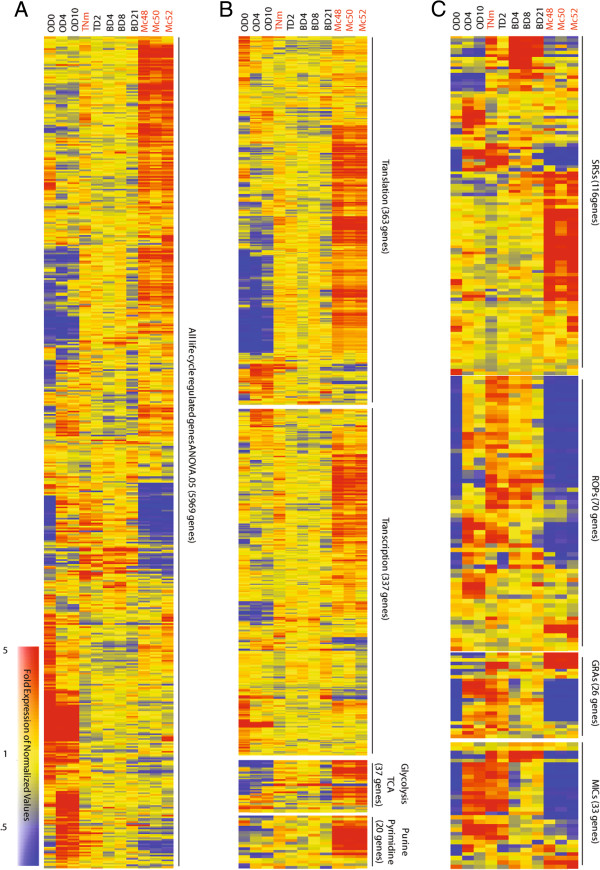
Clustering of significantly regulated life cycle gene groups. (A) Heatmap of life cycle regulated genes. A total of 5,969 genes were found to have significant expression differences (ANOVA .05). (B) Heatmap of cell growth related genes. Many genes with growth and/or metabolism related Gene Ontology were upregulated at the merozoite stage. (C) Heatmap of Apicomplexa specific genes. The ROP, GRA and MIC gene families were downregulated as a class and many SRS genes were upregualted upon entering the enteric stages.