. 2014 May 9;15(1):351. doi: 10.1186/1471-2164-15-351
© Zhou et al.; licensee BioMed Central Ltd. 2014
This article is published under license to BioMed Central Ltd. This is an Open Access article distributed under the terms of the Creative Commons Attribution License (http://creativecommons.org/licenses/by/2.0), which permits unrestricted use, distribution, and reproduction in any medium, provided the original work is properly credited. The Creative Commons Public Domain Dedication waiver (http://creativecommons.org/publicdomain/zero/1.0/) applies to the data made available in this article, unless otherwise stated.
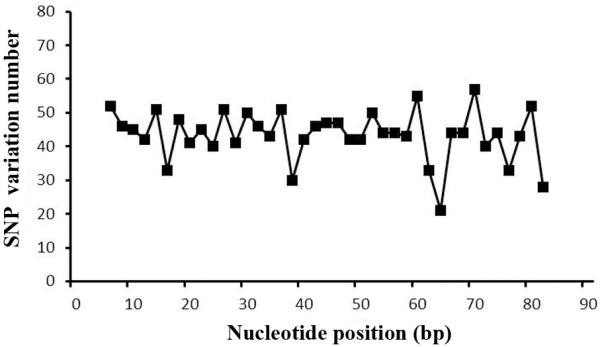
Figure 3.

The distribution of the total number of SNP variations at each nucleotide position for each read.
