
Figure 5.
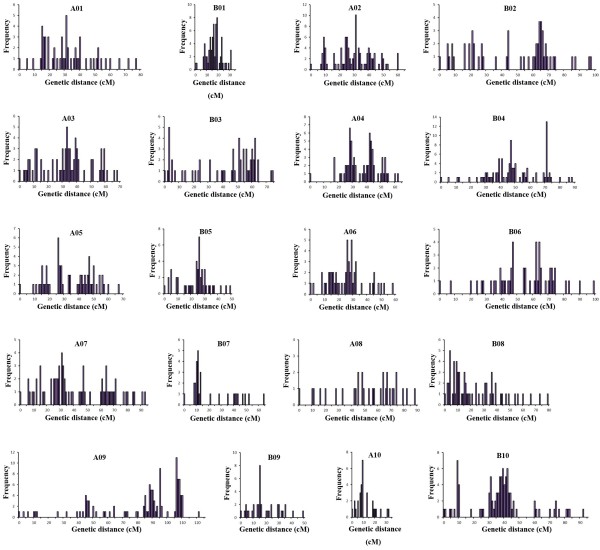
The X axis indicates the position in each linkage group in 1 cM intervals, and the Y axis indicates the number of bins within 1 cM.
Official websites use .gov
A
.gov website belongs to an official
government organization in the United States.
Secure .gov websites use HTTPS
A lock (
) or https:// means you've safely
connected to the .gov website. Share sensitive
information only on official, secure websites.
The X axis indicates the position in each linkage group in 1 cM intervals, and the Y axis indicates the number of bins within 1 cM.