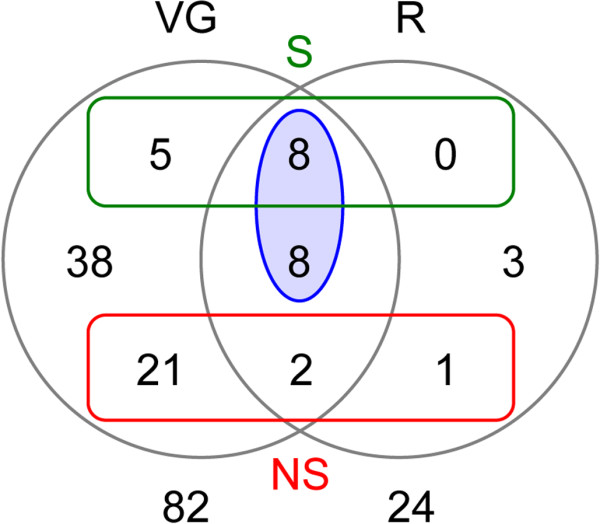
Figure 2.

Venn diagram showing the repartition of unisequences found in proteomics between venom glands (VG) and reservoirs (R). The green and red rectangles highlight the number of unisequences for which sequence was complete and that were predicted to be secreted (S) or predicted not to be secreted (NS), respectively. The blue ellipse corresponds to considered “putative venom proteins”.
