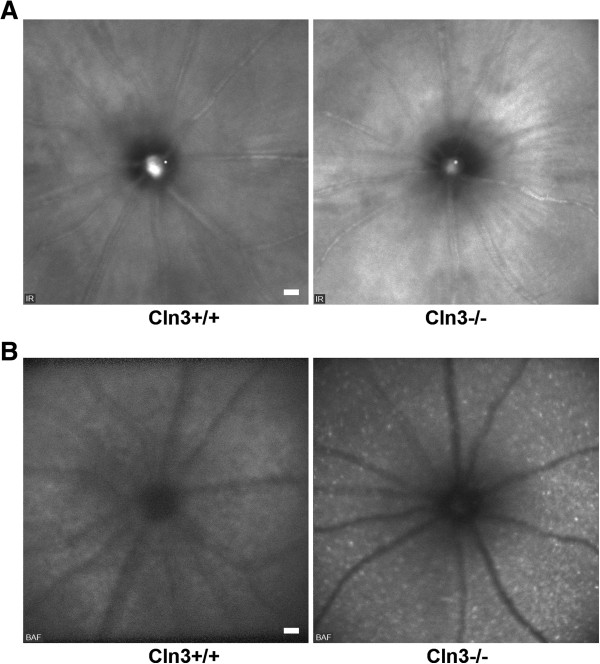
Figure 3.

Funduscopy of 16-month-old Cln3 +/+ and Cln3 -/- mice. A: IR fundus images revealed no obvious differences in general retinal appearance of Cln3 -/- mice compared with controls (n = 4 per group). However, based on the different genetic background, both Cln3 genotype groups showed brighter overall appearance of retinae in comparison with Ppt1 genotype groups (see Figure 2A). Optic disc and major blood vessels were well recognizable. B: Accumulation of hyperfluorescent profiles in the inner retinal layers of Cln3 -/- mice in comparison with Cln3 +/+ mice was obvious in BAF fundus images. Scale bars correspond to 50 μm of subtended retina.
