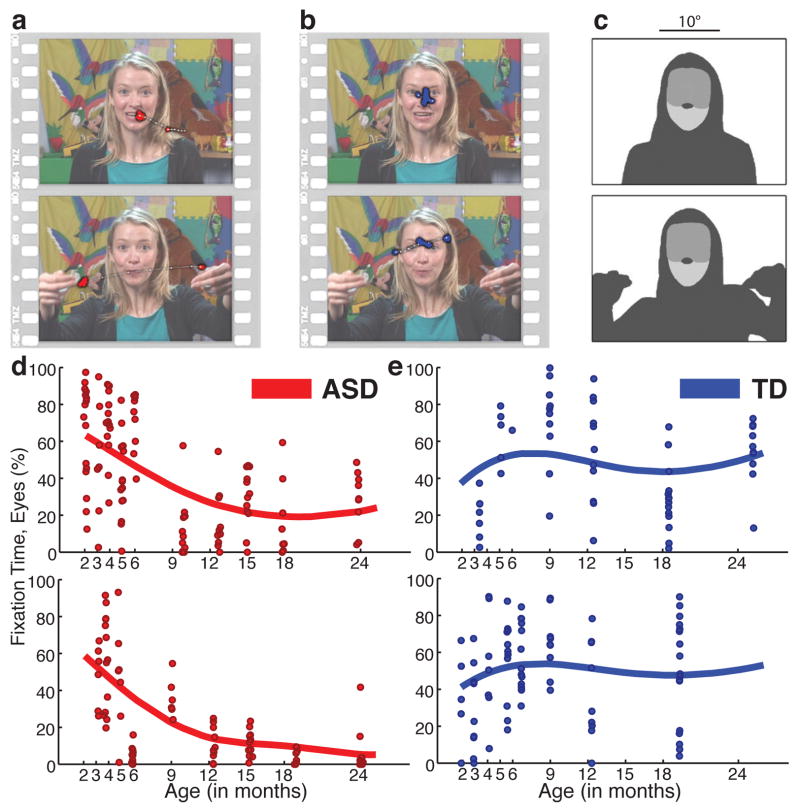
Figure 1. Example stimuli, visual scanpaths, regions-of-interest, and longitudinal eye-tracking data from 2 until 24 months of age.
a, Data from 6-month-old later diagnosed with ASD, red. b, Data from typically-developing (TD) 6-month-old, blue. Two seconds of eye-tracking data are overlaid on each still image, onscreen at the midpoint of the data sample. Saccades plotted as thin white lines with white dots; fixation data plotted as larger colored dots. c, Corresponding regions of interest for each image in a and b, shaded to indicate eye, mouth, body, and object regions. Trial data with FDA curve fits plotting percentage of total fixation time on eyes, from 2 until 24 months of age, for d, 2 children with ASD and e, 2 TD children.

