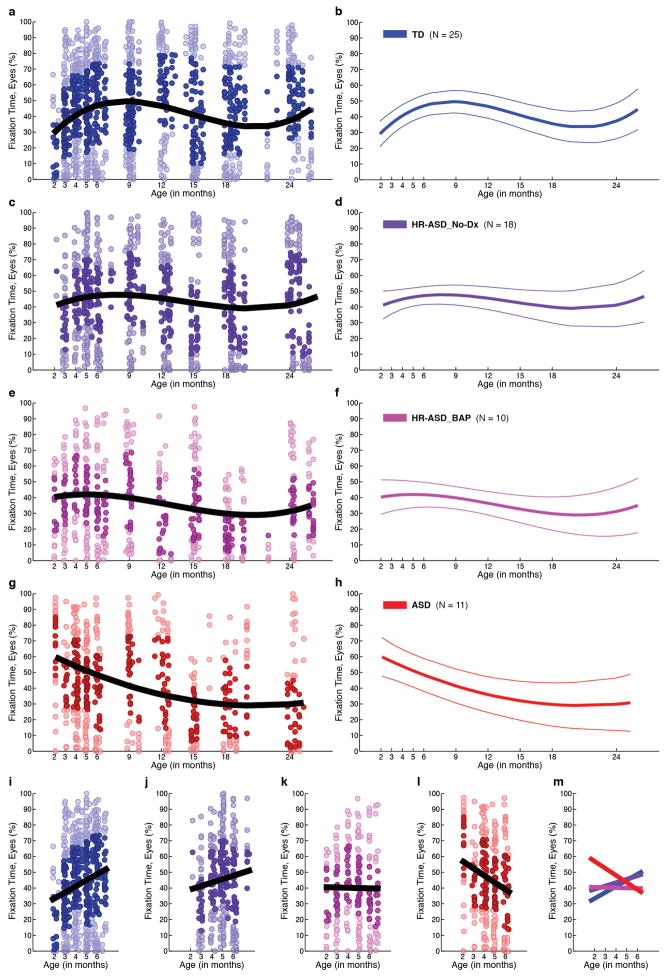
Extended Data Figure 6. Developmental change in visual fixation on the eyes relative to outcome levels of affectedness.
Percent fixation on eyes for (a) typically-developing infants; (c) infants at high-risk for ASD who showed no evidence of ASD at 36 months (HR-ASD_No-Dx); (e) infants at high-risk for ASD who showed some sub-thresholds signs of the Broader Autism Phenotype at 36 months but did not meet clinical best estimate diagnosis of ASD (HR-ASD_BAP); and (g) infants diagnosed with ASD at 36 months. External validation participants not included (in contrast to Figure 4 in main text). Darkly shaded data markers indicate the interquartile range (spanning 25th to 75th percentiles). Black lines indicates mean growth curves via hierarchical linear modeling (HLM). Plots in b, d, f, and h show mean fixation curves with 95% CI. Plots i–l highlight the first 6 months of life in each group, and m plots the relationship across groups.

