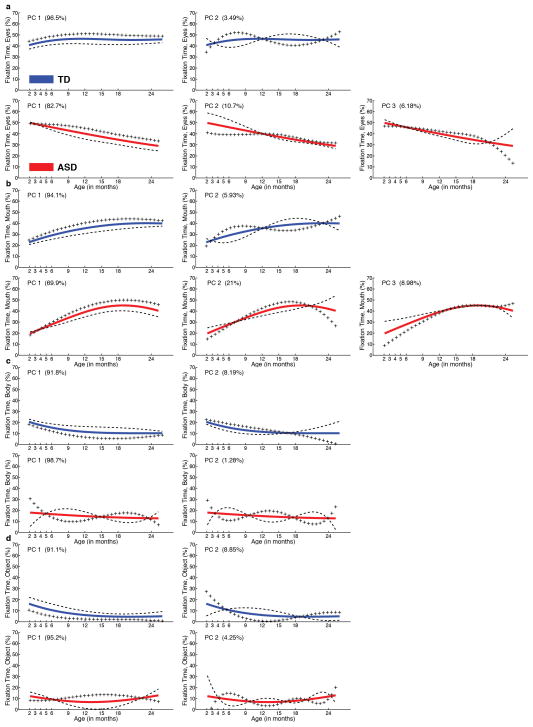
Extended Data Figure 7. Mean fixation curves by PACE/FDA with the effects of adding (+) or subtracting (−) principal component (PC) functions.
(following the convention of Ramsay and Silverman, ref. 21). a, eyes fixation, b, mouth fixation, c, body fixation, and d, object fixation for both typically-developing infants (in blue) and infants with autism (in red). For each region and each group, number of plots is dictated by number of PC functions. Number of PC functions was determined by the Akaike Information Criterion. The fraction of variance explained (FVE) is given in parentheses in the upper left corner of each plot. The mean functions in each case match those plotted in Main Text Figure 2.

