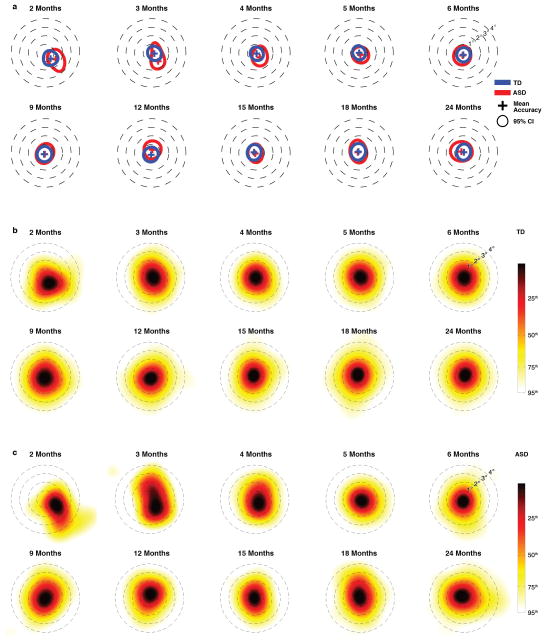
Extended Data Figure 8. Calibration accuracy from 2 until 24 months of life in typically-developing children (TD) and in children diagnosed with an autism spectrum disorder (ASD).
In plots in a, the cross marks the location of mean calibration accuracy, while the annulus marks the 95% confidence interval (CI). In b, kernel density estimates plot the distribution of fixation locations relative to fixation targets for Typically-Developing (TD) children. In c, kernel density estimates plot the distribution of fixation locations relative to fixation targets for children diagnosed with an Autism Spectrum Disorder (ASD). Smoothing bandwidth for kernel density estimates was equal to 1°. Targets for testing calibration accuracy consisted of spinning and/or flashing points of light and cartoon animations, ranging in size from 1° to 1.5° of visual angle, presented on an otherwise blank screen, all with accompanying sounds

