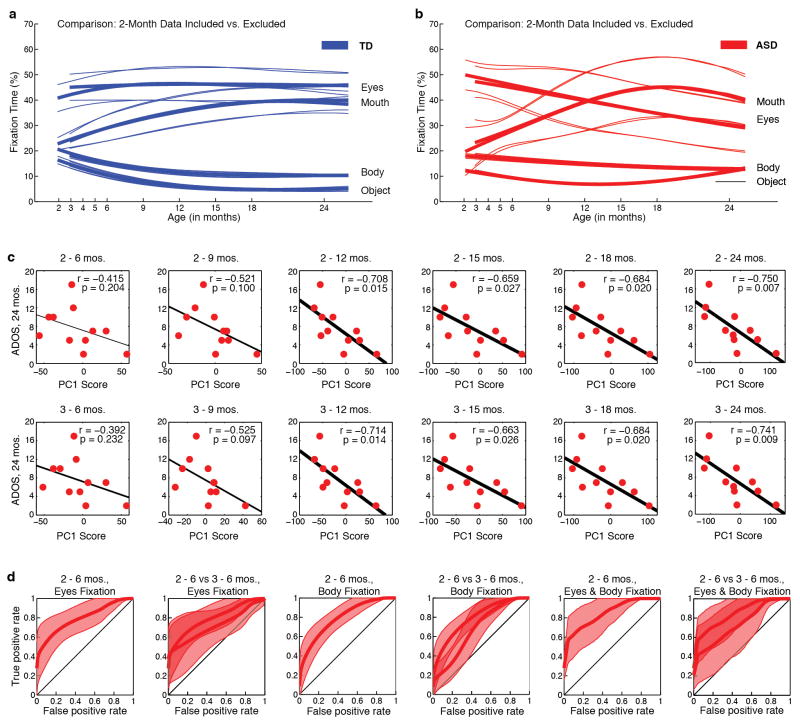
Extended Data Figure 9. Growth charts of social visual engagement and their relationship to dimensional and categorical outcome, with data from month 2 included versus excluded.
Comparison of growth curves with month 2 data included or excluded for a, Typically-Developing males (TD, in blue) and, b, for males with an autism spectrum disorder (ASD, in red). Exclusion of the month-2 data does not significantly alter the trajectories themselves, nor does it alter the between-group comparisons. c, Outcome levels of social disability (as measured by ADOS social-affect score) as a function of decline in eyes fixation (measured as eyes PC1 score, as in Extended Data Figure 1) using subsets of the longitudinal data (i.e., decline in eye fixation using only data collected between months 2–6 or 3–6, excluding data thereafter; then between months 2–9 or 3–9, etc.). In top row, month 2 data are included; in bottom row, month 2 data are excluded. When month 2 data are included or excluded, decline in eye fixation still significantly predicts future outcome; this relationship reaches trend level significance by 3–9 months (P = 0.097), and is statistically significant thereafter (with r = −0.714, P = 0.014 for 3–12 months). d, ROC curves for classification of infants with confirmed ASD outcomes relative to typically-developing infants. Using leave-one-out cross-validation, plots show mean and 95% confidence intervals for classification based on change in eye fixation (first two plots from left), change in body fixation (middle two plots), and change in both eye and body fixation (last two plots at right) between 2 and 6 months of age. Plots show ROC classification using data from months 2–6 and for the comparison of months 2–6 relative to months 3–6. With month-2 data excluded, confidence intervals for the cross-validated ROC curves increase in size (as expected, in proportion to the reduction in data by excluding month 2), but the curves remain significantly different from chance, and the ROC curves with month 2 data included or excluded are not significantly different from one another.

