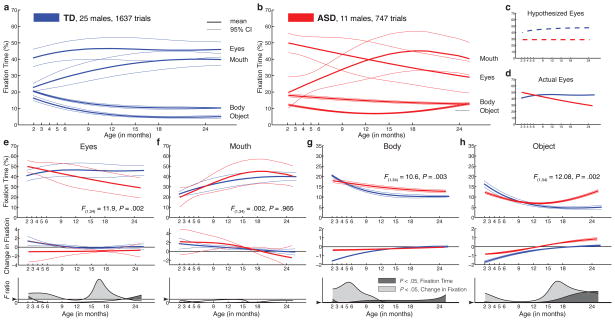
Figure 2. Growth charts of social visual engagement for typically-developing children and children diagnosed with ASD.
Fixation to eyes, mouth, body, and object from 2 until 24 months in a, TD and, b, ASD. c, Contrary to a congenital reduction in preferential attention to eyes in ASD, d, children with ASD exhibit mean decline in eye fixation. Longitudinal change in fixation to e, eyes; f, mouth; g, body; and h, object regions; between-group comparisons by functional ANOVA. Dark lines indicate mean growth curves, light lines indicate 95% CI. Top panels in e-h plot percent fixation; middle panels plot change in fixation (the first derivative, in units of % change per month); and bottom panels plot F value functions for between-group pointwise comparisons. Significant differences are shaded in medium gray for comparison of fixation data and light gray for comparison of change-in-fixation data.

