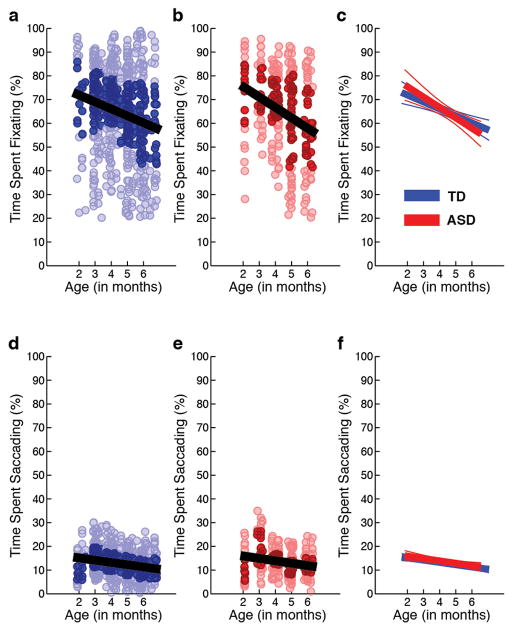
Extended Data Figure 3. Percentage of total time spent fixating and saccading between 2 and 6 months of age.
Raw data for percentage of total time spent fixating (a–c) and time spent saccading (d–f) between 2 and 6 months for typically-developing infants (in blue) and infants with autism spectrum disorders (in red). Darkly shaded data markers indicate the interquartile range (spanning 25th to 75th percentiles). Data show significant associations with chronological age, but the slopes of the associations do not differ for ASD and TD outcome groups, F(1,20.026) = 0.88, P = 0.359 for time spent fixating; and F(1,26.430) = 0.56, P = 0.460 for time spent saccading. Analyses by HLM. Plots in c and f show mean trend lines and 95% CI.

