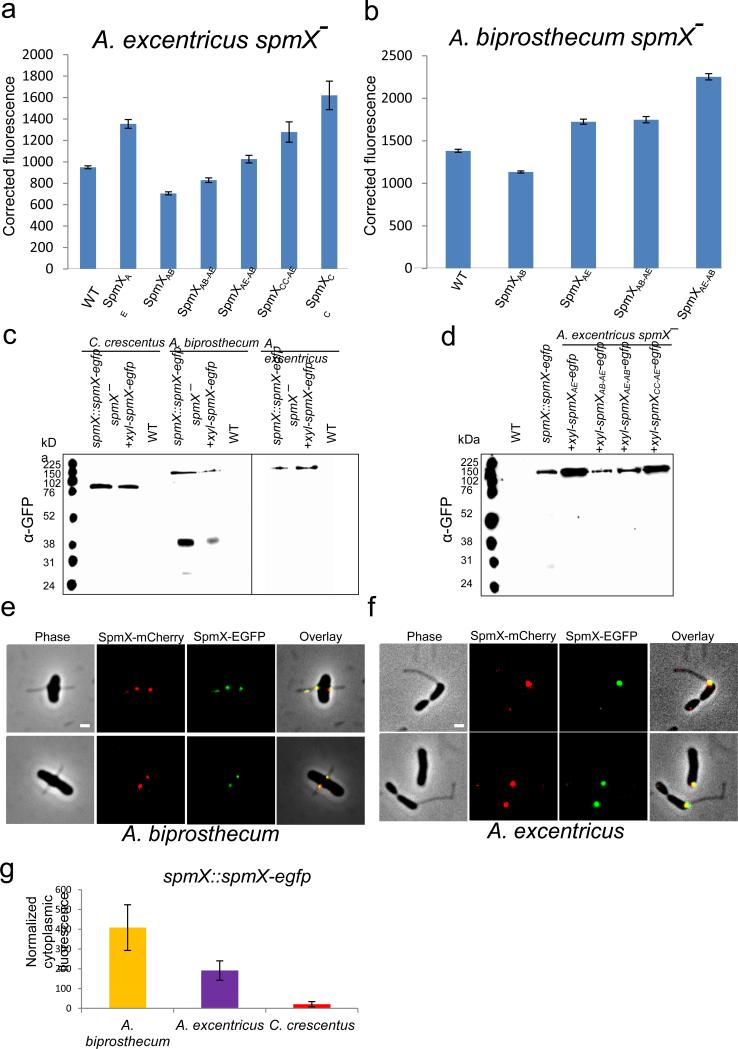
Extended Data Figure 3.
Expression and integrity of various SpmX-EGFP fusions. (a-b) Expression level of SpmX-EGFP in strains used in this study. All fusion proteins were expressed from a xylose-inducible promoter on a replicating plasmid in the presence of 0.05% (w/v) xylose. SpmX-EGFP expression level was measured by quantifying the fluorescence intensity of the fusion proteins. Corrected fluorescence is calculated as (integrated fluorescence-integrated background)/area. Measurements for each strain were done in duplicate and at least 500 cells were quantified in each case. Error bars denote standard error of the mean. (c) Western blot of SpmX-EGFP fusion proteins expressed from either the chromosomal locus or a replicating plasmid in different species probed with anti-GFP antibody. Wild-type strains were used as controls. Note that only SpmXAB-EGFP appears to have a clipping/degradation pattern. Data are representative of three biological repetitions. (d) Western blot of various chimeric/heterologous SpmX-EGFP fusions when expressed in the A. excentricus spmX− mutant, probed by anti-GFP antibody. Note that the relative levels of expression correlate with the results from quantitative fluorescence analysis (a). The size of SpmX-EGFP fusions ranges from 76 kDa to 120 kDa and free EGFP is expected to be around 31 kDa. Data are representative of three biological repetitions. (e-f) SpmX-mCherry and SpmX-EGFP share the same localization pattern in A. biprosthecum (left, Pearson r=0.79±0.1) and A. excentricus (right, Pearson r=0.81±0.08) cells. Both strains are expressing SpmX-EGFP fusions from the chromosomal locus and the SpmX-mCherry fusions from a replicating plasmid. Scale bars, 1 μm. Data are representative of two biological repetitions. (g) The elevated cytoplasmic fluorescence in A. biprosthecum may correlate with the clipping/degradation pattern of SpmXAB-EGFP. Data are representative of two biological repetitions analyzing at least 100 cells each. Error bars, standard deviation.

