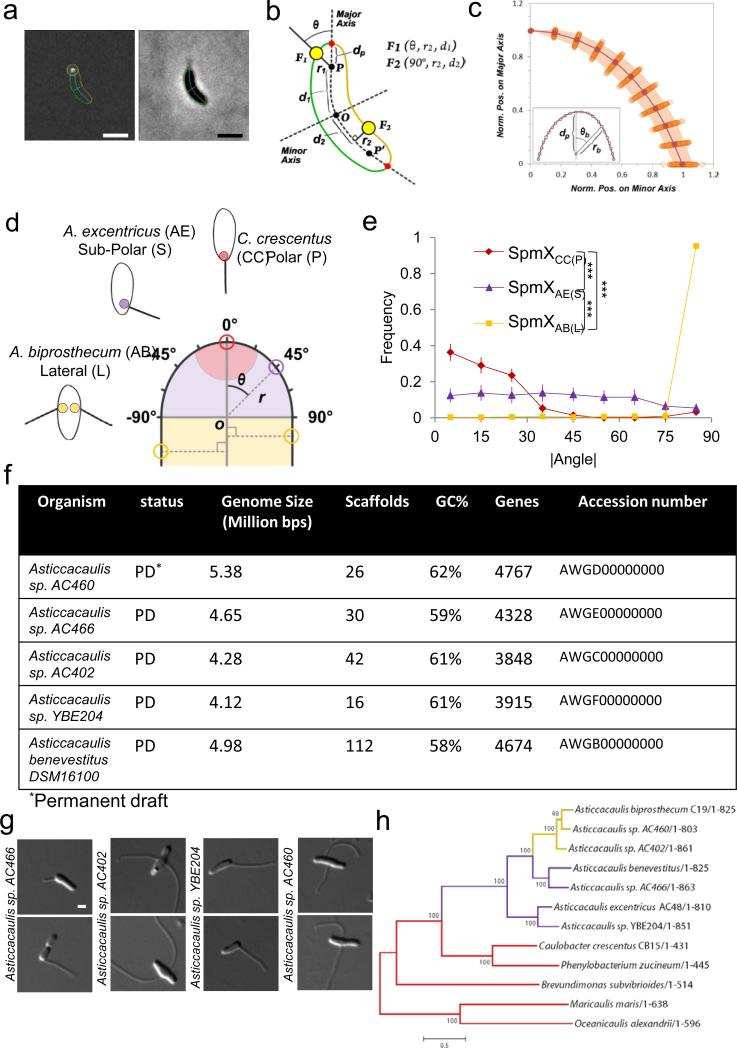
Extended Data Figure 5.
Overview of the sub-cellular localization quantification method and characteristics of newly sequenced genomes. (a) Output images provided by the customized ImageJ-based software package. Fluorescent (left) and corresponding phase contrast (right) images are shown. The cell boundary is represented in green or orange according to the side of the cell. The major and the minor axes of the cell are represented in cyan. In each cell, fluorescent foci of SpmX-GFP (white spot, left panel) were detected and outlined by a yellow circle centered to their respective sub-pixel resolution positions. The dark blue line links the focus coordinates to its relative position on the major axes. (b) Schematic representation of the polar coordinate system in which each point is defined by three coordinates: the distance from the pole or from the major axis (r1, r2), the angle relative to the major axis (θ1, θ2) and the distance from the mid-cell (d1, d2). A null angular coordinate means that the focus is localized at the tip of the cell pole, whereas 90° means that the focus is localized on cell sides. dP represents the distance between the pole (P or P’) and the cell boundary (red dot). F1 and F2 represent sub-polar and lateral localized objects with their respective coordinates. (c) Variation of the position of discrete points on the cell boundary relative to the pole (P or P’) as determined by the polar coordinates (n=100). Each point represents the normalized position on the major (rb/dp × cos(θb)) and the minor (rb/dp × sin(θb)) axis of discrete positions along the cell boundary in the pole region. The shaded region indicates the interquartile range (IQR) as a measure of the dispersion between the upper and lower quartiles of values observed for discrete values of θb. (d) Schematic showing how localization of SpmX-EGFP is quantified by measuring the angle (θ) and the radial distance (r) of each focus using the geometric center of the pole as the origin of a polar coordinate system within a normalized cell body (see a-c). Red, purple, and yellow colored circles represent SpmX in C. crescentus (CC), A. excentricus (AE), and A. biprosthecum (AB), respectively. P, S, and L in parentheses are shorthand to denote the native polar, sub-polar, and lateral stalk positioning of their respective SpmX proteins. (e) Density plot of the absolute values of measured angles (|θ|) of heatmaps in Figure 2b (same N). Measurements are binned for every 10 degrees. Error bars in the angle profiles denote standard deviation of the sample evaluated by the Jackknifing method (see Methods). (f) The general characteristics of five Asticcacaulis genomes. PD denotes the permanent draft status of the genome. (g) DIC micrographs of the sequenced strains in (f) except for A. benevestitus, which was previously published39. Scale bars, 1 μm. (h) Phylogenetic tree inferred from SpmX sequences of different species. The alignment from Extended Data Figure 8 was used to infer this tree based on the maximum likelihood method. Note that since E. coli and P. aeruginosa do not have spmX orthologs, species from the Hyphomonadaceae family serve as the outgroup (Maricaulis maris and Oceanicaulis alexandrii). We estimated the statistical support for each node by performing 500 bootstrap repetitions. The overall SpmX protein tree topology matches that of the species tree (Fig. 1d). The only exception is that Brevundimonas subvibriodes is placed differently, due to the difficulty of resolving its phylogeny40. Scale, number of substitutions per position.

