
Fig. 2.
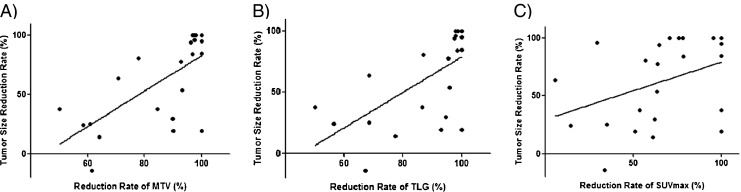
Scatter-gram and linear regression line between tumor size reduction rate and reduction rate (RR) of 18F-FDG PET/CT indices; Significant correlation was found in MTV (a, r = 0.68, P = 0.0004) and TLG (b, r = 0.62, P = 0.002), but not in SUVmax (c, r = 0.38, P = 0.07)