Fig. 4.

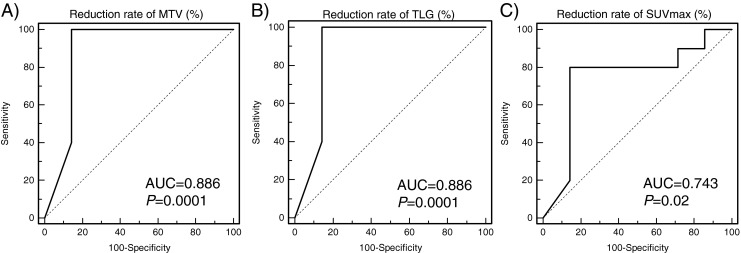
ROC curve analysis of response prediction by reduction rate of 18F-FDG PET/CT indices (a, reduction rate of MTV; b, reduction rate of TLG; c, reduction rate of SUVmax). AUCs of reduction rate of MTV, TLG, SUVmax were 0.886, 0.886 and 0.743

ROC curve analysis of response prediction by reduction rate of 18F-FDG PET/CT indices (a, reduction rate of MTV; b, reduction rate of TLG; c, reduction rate of SUVmax). AUCs of reduction rate of MTV, TLG, SUVmax were 0.886, 0.886 and 0.743