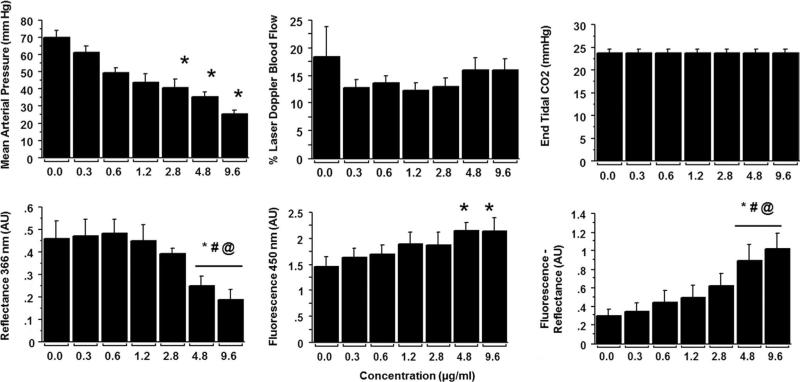
Fig. 5.
Dose response with IC NADH injections: Bar graphs representing statistical analysis of mean arterial pressure (A), percent change in cerebral blood flow (B), end-tidal CO2 (C), and 366 nm reflectance (D), 450 nm fluorescence (E) and the increase in NADH as judged by the difference between fluorescence-reflectance. Symbols: significant difference from: *: saline; #: from .3 mg/ml of NADH; and @: from 0.6 mg/ml of NADH.

