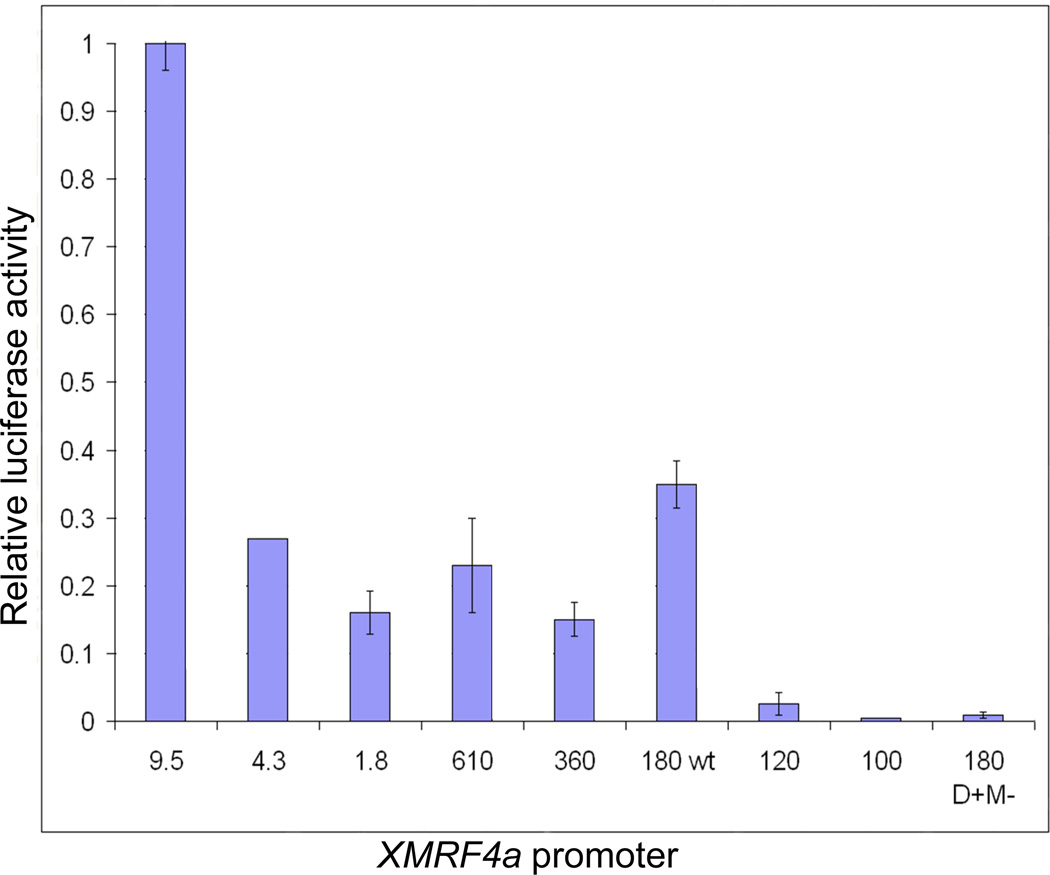
Figure 3. Relative activity of XMRF4a promoters in mouse myotubes.
The graph shows averages of values ± s.e.m. from two to four independent transient transfection experiments for each XMRF4a construct, except for 4.3-kb which is a single datum. Each experimental value is the average of two separate C2C12 cell transfections, expressed as the ratio of test construct to RL-SV40 control, normalized to the value obtained for a positive control construct.

