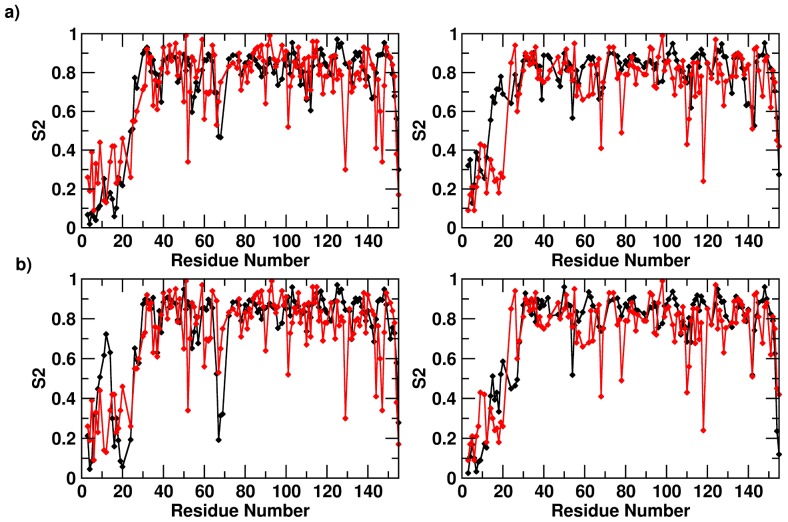
Figure 2. Comparison between the experimental and calculated S2 values.
The direct comparison between experimental (red) and calculated (black) S2 parameters. Comparison between the two values for the apo (a) and holo (b) systems for S2 calculated over the whole trajectory. Panel c) shows the comparison of experimental (red) S2 parameters with values calculated over the 100 ns trajectory interval (black) that yield the best agreement (200–300 ns).

