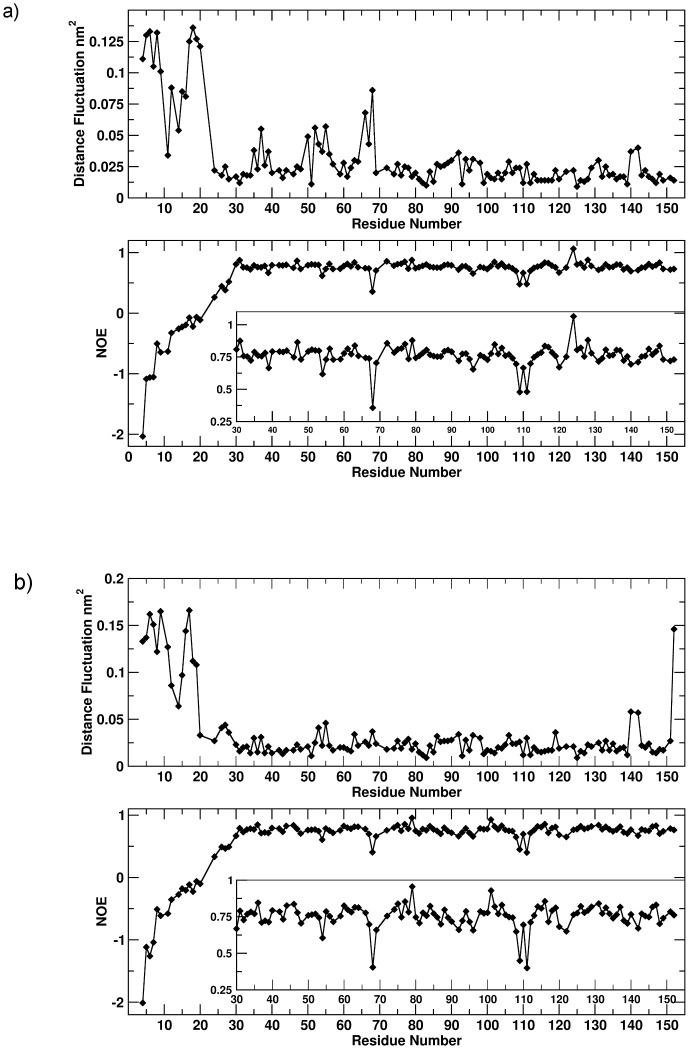
Figure 3. Comparison between the experimental and calculated local dynamics.
a) Comparison between local dynamics for the apo system, calculated over the 100 ns trajectory interval yielding the best match (800–900 ns). b) Comparison between local dynamics for the holo system, calculated over the 100 ns trajectory interval yielding the best match (200–300 ns). The insets show a magnification of the graphs to improve clarity.

