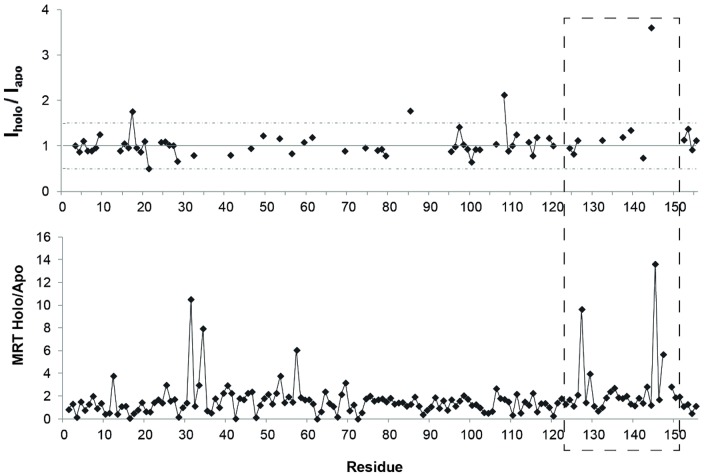
Figure 6. FGF2 hydration changes induced by Sm27 binding.
Upper panel: ratio of the normalized intensities observed for holo and apo FGF2 is reported as a function of the residue number as derived from ePHOGSY NOE spectra. Dotted lines delimit intensity variations beyond ±50% upon sm27 binding. Lower panel: Ratio of the mean residence time (MRT) per residue calculated for all atoms over the whole MD trajectories of apo and holo protein. Distance cut-off of 3.5 Å was used. Dashed gray line highlights the binding site regions.

