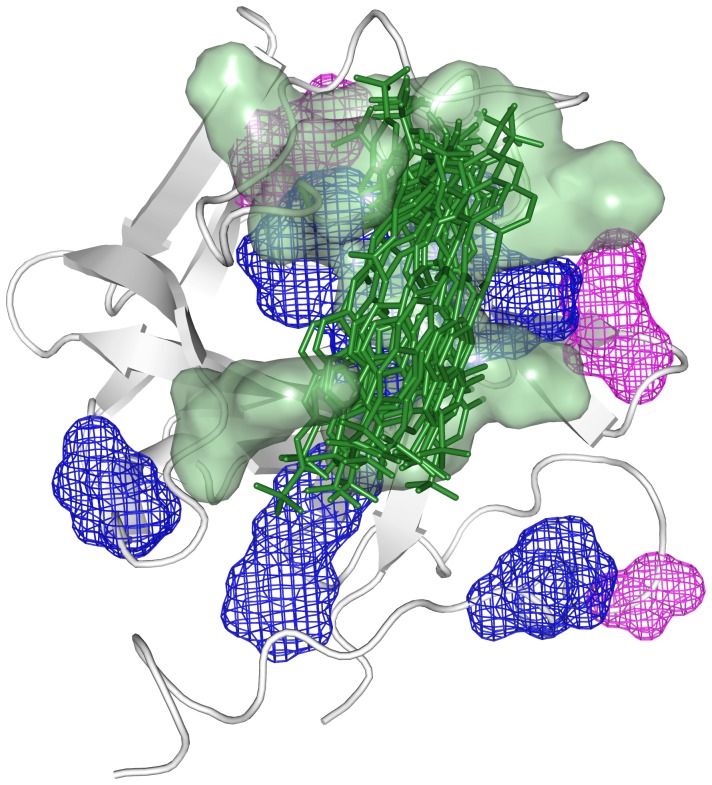
Figure 7. FGF2 hydration changes induced by sm27 binding.
Residues affected by hydration changes upon sm27 binding, as deduced from MRT analysis (blue) and ePHOGSY NMR data (magenta) are shown as mesh. Residues Y33, K35, N36, R53, K128, R129, K134, Q143, K144, A145, involved on the average in the contact with the ligand (green sticks), are shown as green surface.

