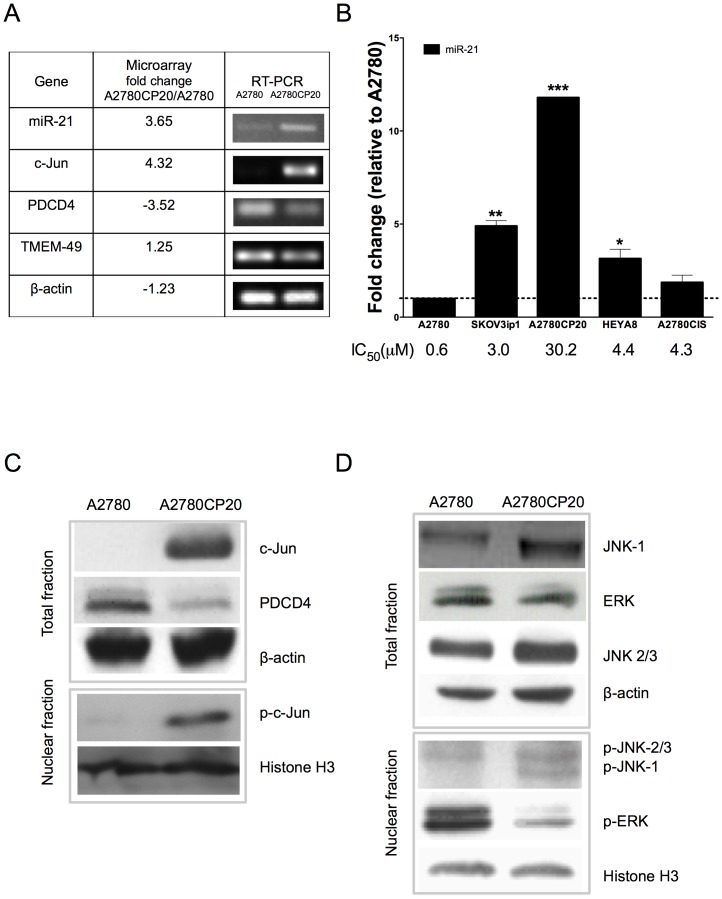
Figure 1. RT-PCR and western blot analysis of miRNA-21-related molecules.
(A) Validation of microarrays by RT-PCR. (B) MiR-21 levels in a panel of ovarian cancer cells. MiR-21 levels were expressed relative to the A2780 cells miR-21 levels. IC50s were calculated after 72-hr treatment of cells with different concentrations of cisplatin as described in the “Material and Methods” section. (C) Evaluation of c-Jun and p-c-Jun protein expression in A2780 and A2780CP20 cells. (D) Protein expression analysis of MAPKs in total and nuclear fractions of A2780 and A2780CP20 cells. Expression level in Figures A, C and D are without cisplatin treatment. *p<0.05, **p<0.01, ***p<0.001 compared to control. Columns represent the means of triplicates ± S.E.M.

