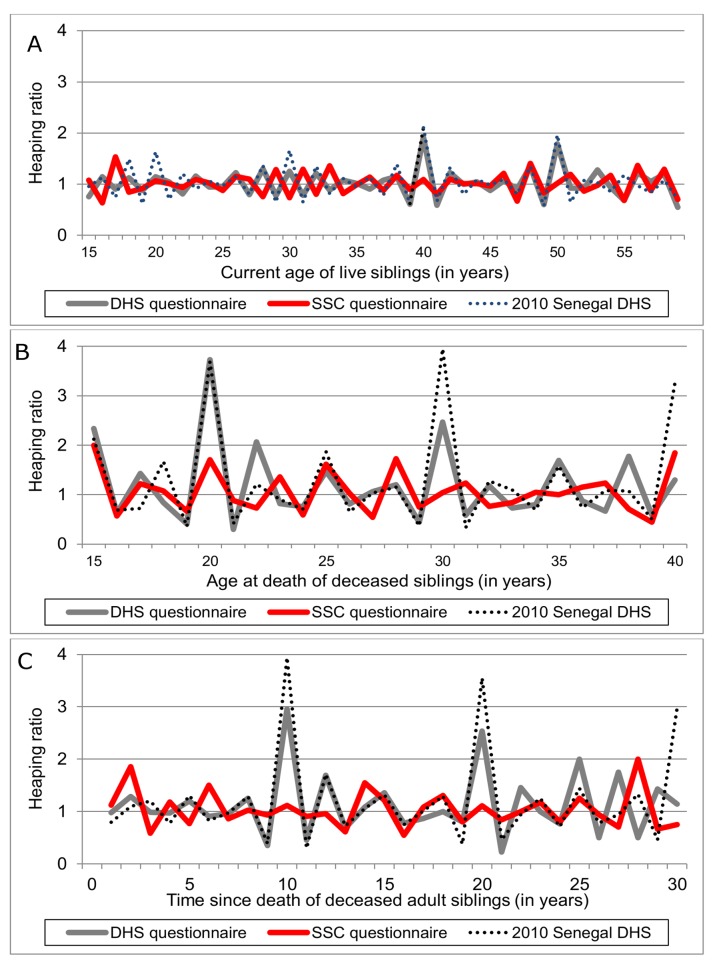
Figure 3. Age/date heaping in siblings' survival histories, by study group.
(A) Current age of live siblings; (B) age of sibling at death; (C) date of sibling death. The time series represented here are heaping ratios calculated as indicated in Equation 1. In (B), we did not include data on deaths at ages 40 y and above because of limited sample size. Deaths at ages 40 y and above are, however, included in (C).

