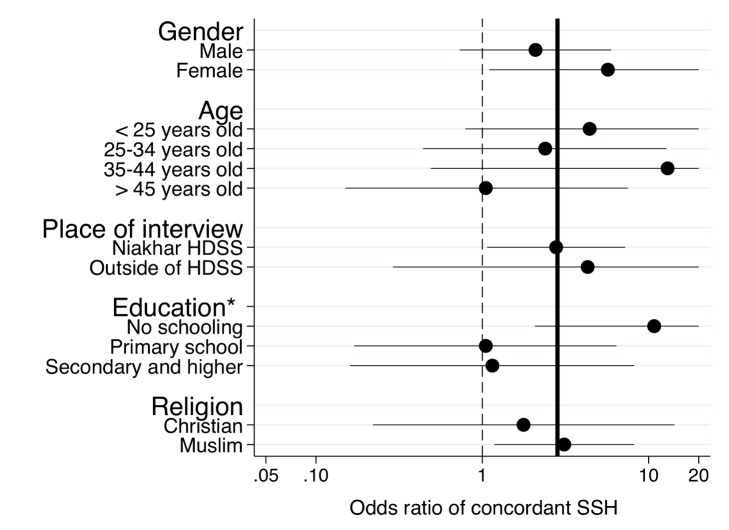
Figure 5. Subgroup analyses of the effects of the SSC on the sensitivity of SSH data for adult female deaths.
The analytical sample for the analyses is constituted of respondents with at least one adult death among their sisters according to the HDSS dataset. The circles in the graphs represent odds ratios of reporting an adult female death associated with use of the SSC questionnaire among respondents in these sibships. Error bars represent 95% confidence intervals. Confidence intervals are clipped at 20. Estimates of odds ratios are obtained from stratified Mantel-Haenszel odds ratios. We tested for homogeneity of odds ratios across all strata of the classifying variable. The thick line represents estimates of the odds ratios for the full sample of the validation study. The dashed line corresponds to an odds ratio equal to 1. *p<0.1, tests of significance refer to the test of the homogeneity of the odds ratio across strata of the classifying variable.

