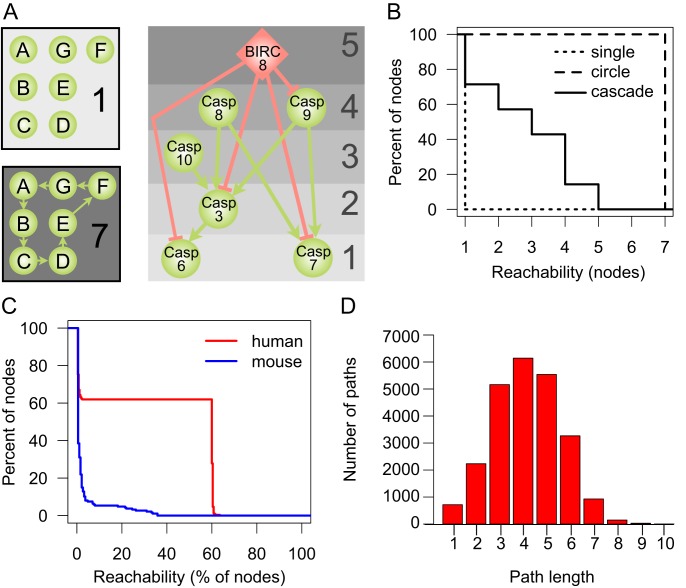
Figure 2. Reachability in network examples and the human and murine protease webs.
Connectivity in the protease networks as measured by the reachability distribution of nodes in the network. (A) Reachability in three theoretical model networks: In an unconnected network without edges, each node has a reachability of 1. In a strongly connected network, where each node can reach each other node, the reachability of each node is the sum of nodes. In a hierarchical, cascade-like network (apoptosis cascade taken from KEGG [80]), reachability values are high for upstream regulators and decrease as one descends the cascade towards the downstream effector proteins. For each protein, the corresponding reachability values are shown on the right. Proteases are represented as green circles and inhibitors as red diamonds. Edges are cleavages (green, with arrow head) and inhibitions (red, with “T” head). Although these two types of edges have biologically distinct interpretations, the implication for the graph model and reachability is identical. (B) Reachability values of nodes in a theoretical hierarchical cascade (cascade), unconnected (single), or strongly connected (circle) networks shown in (A). Reachability is plotted as an inverse cumulative function of the percentage of nodes, which can reach a given minimum number of nodes in the corresponding network. (C) Inverse cumulative function of reachability values of the largest connected components of the human protease web (255 nodes, red line) and the mouse protease web (187 nodes, blue line). Reachability is plotted as the inverse cumulative function of the percentage of nodes that can reach a given minimum percentage of nodes in the corresponding network. (D) Histogram of the path length of all shortest paths in the human network comprised of a total of 24,166 paths.

