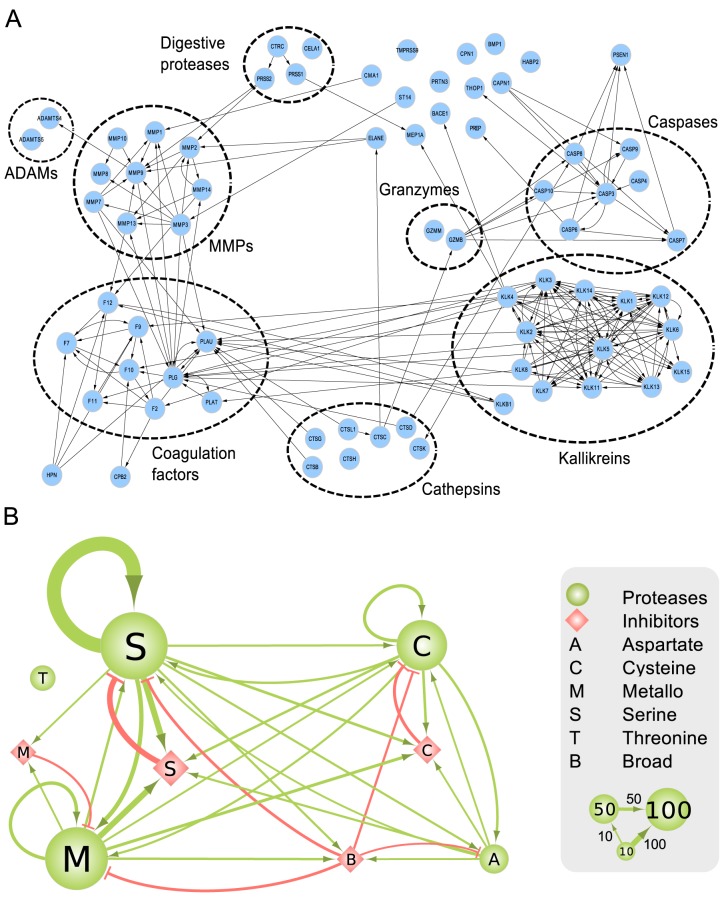
Figure 4. Interactions between protease groups in the human protease web.
(A) Click-to-zoom figure of detailed connections between pathways and protease groups in the strongly connected component of the network. The network presented is limited to proteases (no inhibitors) with a reachability of 153 from Figure 3. Nodes are proteases and edges are cleavages. Proteases are designated by their UniProt gene names. (B) Interactions between classes of proteases and their inhibitors. Nodes are classes of proteins: classes of proteases are green circles; classes of protease inhibitors are red diamonds. The size of the nodes represents the number of proteins in each class as exemplified with groups of 10, 50, and 100 nodes in the legend. Protein classification: “M” are metallo, “S” are serine, “C” are cysteine, “A” are aspartate, and “T” are threonine proteases (as classified in MEROPS) or the corresponding inhibitors (as annotated in neXtProt). “B” are broad-spectrum inhibitors that are annotated to inhibit more than one class of protease and include A2M, serpin B4, serpin B9, PZP, histidine-rich glycoprotein, ovostatin homolog 1, and reversion-inducing cysteine-rich protein with Kazal motifs. Edges are cleavages (green, with arrow head) or inhibitions (red, with “T” head). Thickness of edges corresponds to the number of cleavages or inhibitions between the classes as exemplified with edges corresponding to 10, 50, or 100 interactions in the legend.

