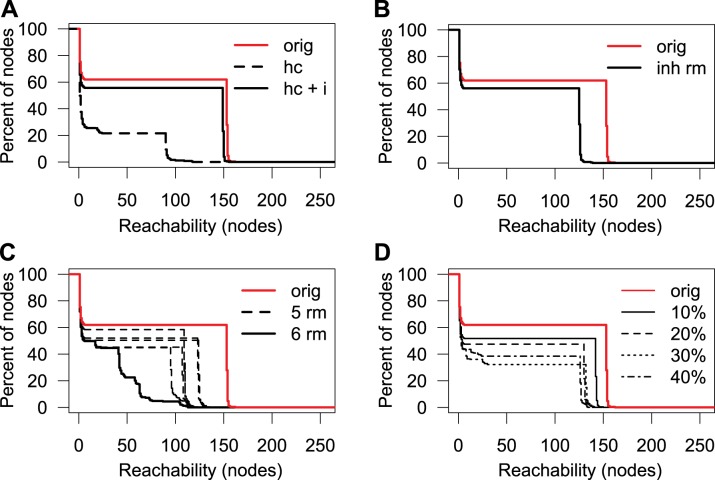
Figure 5. Reachability in the human protease web after various perturbations.
Reachability of the largest connected component of the protease web (shown in Figures 2C and 3) after various perturbations. Reachability is plotted as the inverse cumulative function of the percentage of nodes that can reach a given minimum number of nodes in the corresponding network. (A) Reachability in the high confidence network comprised of nodes annotated as having physiological relevance. The reachability distribution of the original network (“orig,” red solid line as also shown in Figure 2C) is compared to networks where edges were removed to create a high confidence network (“hc,” black dashed line) and the high confidence network plus inhibitors (“hc+i,” black solid line). (B) Reachability before (“orig,” red line) and after (“inh rm,” black line) removing edges, reflecting cleavages of inhibitors. Cleavage edges were removed if (i) the inhibitor is annotated to be a serine protease inhibitor and the protease is a serine or cysteine protease or (ii) the inhibitor is A2M or PZP. (C) Reachability after removal of six nodes from the original network (PLG, alpha-1-antitrypsin, A2M, CTSL1, alpha-1-antichymotrypsin, and KLK4). The reachability after removing these six nodes (“6 rm,” black solid line) is compared to the reachability distribution of the original network (“orig,” red line) and to six networks representing each possible combination of keeping one of the six nodes and removing the other five (“5 rm,” black dotted lines), each showing much smaller reduction in reachability. (D) Reachability after removal of random edges. The reachability in the original network (“orig,” red line) compared to networks where 10%, 20%, 30%, or 40% of edges were removed at random. In each case, random edge deletion was carried out 200 times and the worst AUC value was selected for plotting.

