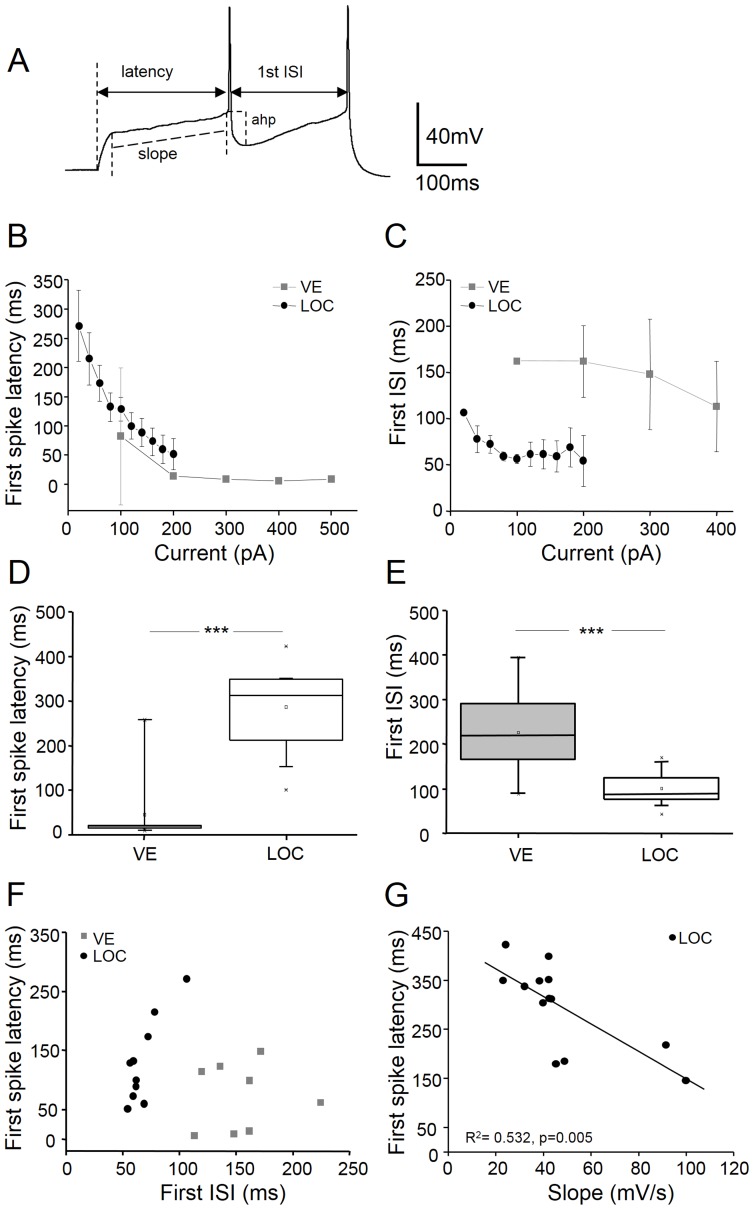
Figure 4. First spike latency and discharge regularity characterize VE and LOC neurons.
An example voltage trace (A) illustrating how the following parameters were measured: latency: from the stimulus onset to the threshold of the first action potential; first inter-spike interval (ISI): from the peak of the first spike to the peak of the following spike; afterhyperpolarization (ahp): from the spike threshold to the deepest voltage of spike repolarization; slope: a linear fit was made to the voltage slope between the depolarizing shoulder leading up to the threshold of the first spike. The first spike latency (B) and the first ISI (C) plotted against current strength in VE (grey squares) and LOC (back circles). The mean values of the first spike latency (D) and the first ISI (E) for VE and LOC neurons at rheobase current levels (VE rheobase: 180±50 pA; LOC rheobase: 44±4 pA). Scatter plot of the mean values of the first spike latencies versus the first ISIs demonstrate that VE and LOC neurons cluster separately (F). The first spike latency is negatively correlated (R2 = 0.534, p = 0.005; Pearson's correlation) against the voltage slope leading up to the first spike in LOC neurons (G). *** p<0.001 by Students unpaired t-test.

