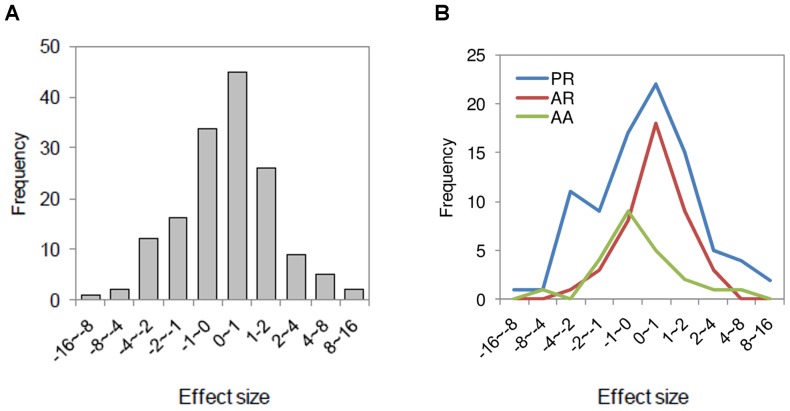
Figure 3. Frequency distribution of effect sizes for plant species richness, animal species richness and animal abundance (A) together and (B) separately.
Mean difference effect size, g, and a mixed (random) effects model were used (PR – plant species richness; AR – animal species richness; AA – animal abundance).

