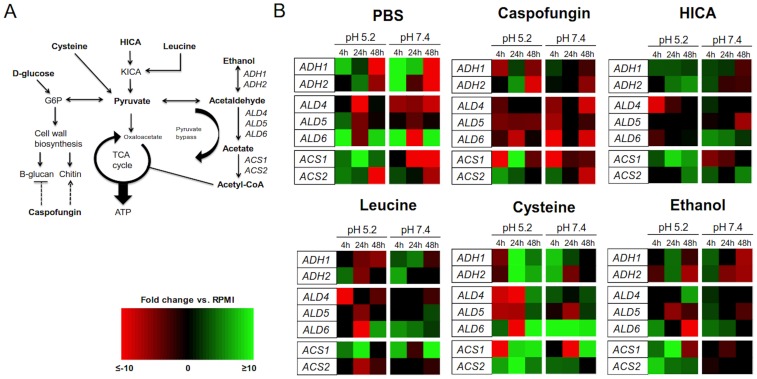
Figure 1. Relative expression of genes related to ACH metabolism.
(A) A schematic model of central carbon metabolism incorporated with genes of interest within ethanol metabolism (abbreviations as follows: G6P = glucose-6-phosphate, KICA = α-ketoisocaproic acid). (B) Heat map panel of gene expression in C. albicans biofilms at three different stages of growth at pH 5.2 and 7.4 after 24 h exposure to PBS, caspofungin, HICA, leucine, cysteine or ethanol. Fold changes are expressed relative to control (RPMI) at the corresponding time point. Black represents no change in expression, green is up-regulation, and red is down-regulation. A brighter color indicates greater degree of change in expression. Relative gene expressions were calculated by the Pfaffl method using the REST 2009 software provided by Qiagen [63].

