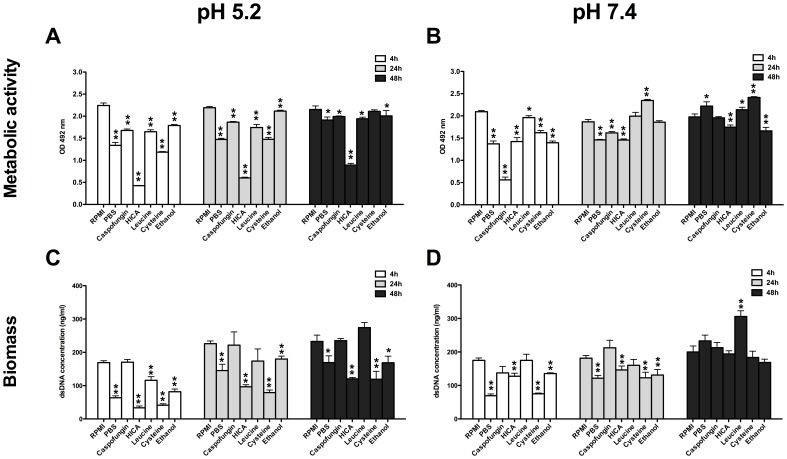
Figure 3. Changes in metabolic activity and biomass of C. albicans biofilms.
Metabolic activities measured by XTT-assay (panel A, B) and dsDNA levels (panel C, D) reflecting the biomass of C. albicans biofilms at pH 5.2 and 7.4. Biofilms were grown for 4, 24 or 48 h in RPMI at pH 7.4 and then exposed to PBS, caspofungin, HICA, leucine, cysteine or ethanol for another 24 h. Values were measured twice in triplicate and expressed as mean (±SEM). Means were compared to the control treatment (RPMI). Statistically significant differences were calculated using a GEE-model and were marked (**p<0.001,* 0.001<p<0.05).

