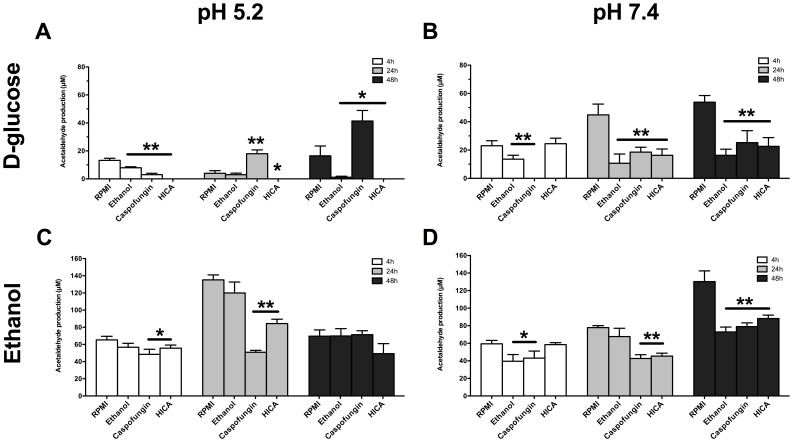
Figure 4. ACH production by C. albicans biofilms.
Mean (±SEM) ACH production by C. albicans biofilms. Biofilms at three different stages of growth (4 h, 24 h and 48 h), were incubated for 30 min at 37°C with 100 mM D-glucose (A,B) or 0.05% ethanol (C,D) after 24 h exposure to RPMI, ethanol, caspofungin or HICA at pH 5.2 or 7.4. Values were measured twice in triplicate and means were compared at each time point to the control treatment (RPMI). Statistically significant differences were calculated using a GEE-model and were marked (**p<0.001, * 0.001<p<0.05).

