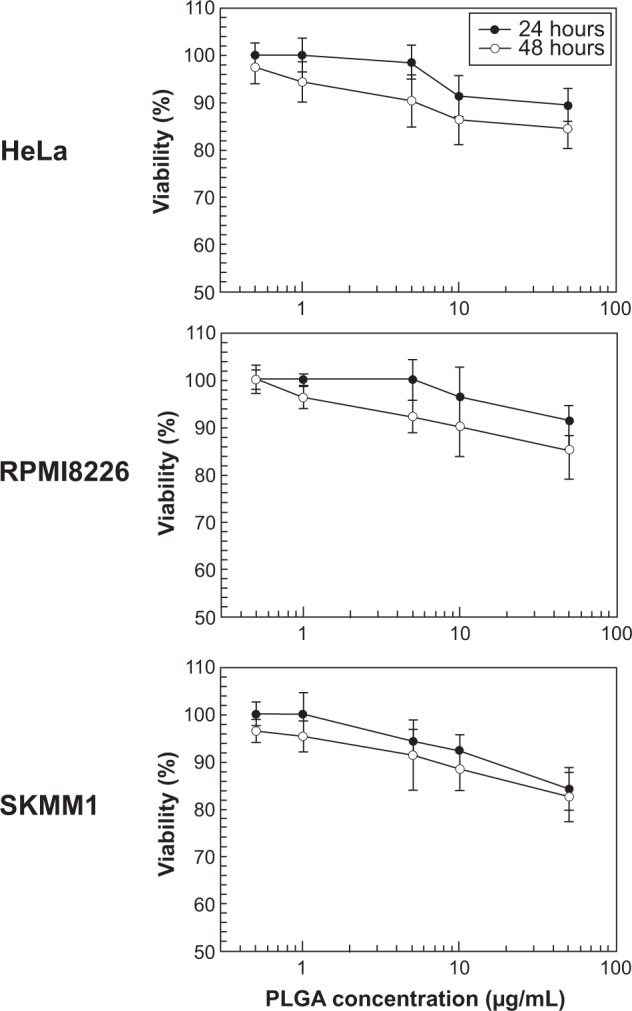
Figure 4.

In vitro cytotoxicity of formulation S in the different cell lines as a function of PLGA concentration and duration of exposure. Data are expressed as percentage of cell viability according to MTT assay. The results are shown as the mean ± standard deviation of four separate experiments. Error bars, if not shown, are within symbols.
Abbreviations: PGLA, poly(D,L-lactide-co-glycolide); MTT, 3-(4,5-dimethylthiazol-2-yl)-2,5-diphenyltetrazolium bromide.
